
ASUS Republic of Gamers and X79 ROG Review – Rampage IV Gene, Formula and Extreme
- Posted in
- Motherboards
- Asus
- X79
- ROG
USB Speed
For this benchmark, we run CrystalDiskMark to determine the ideal sequential read and write speeds for the USB port using our 240 GB OCZ Vertex3 SSD with a SATA 6 Gbps to USB 3.0 converter. Then we transfer a set size of files from the SSD to the USB drive using DiskBench, which monitors the time taken to transfer. The files transferred are a 1.52 GB set of 2867 files across 320 folders – 95% of these files are small typical website files, and the rest (90% of the size) are the videos used in the Sorenson Squeeze test.
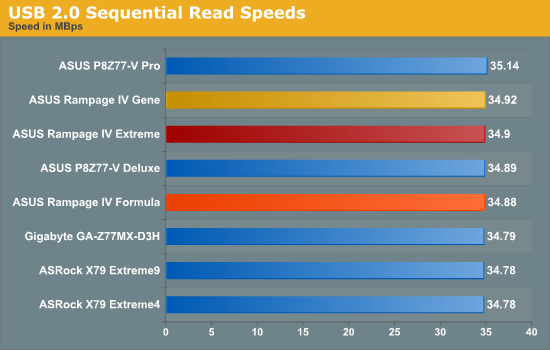
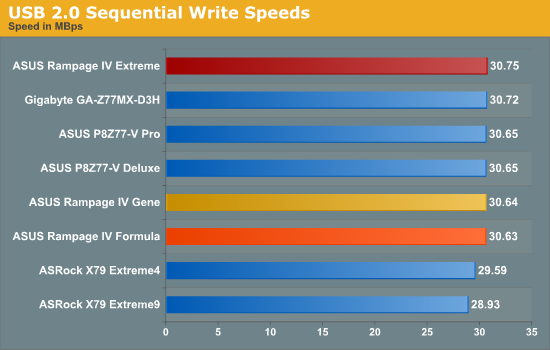
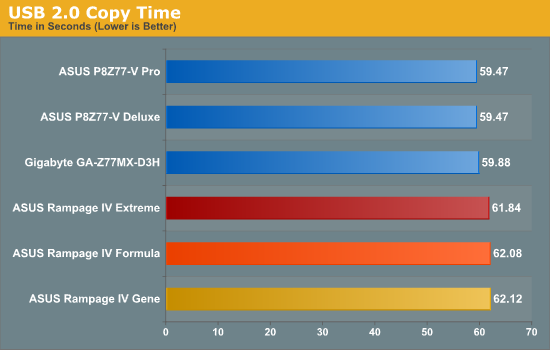
Despite the X79 boards being comparable in terms of incompressible USB transfers, in a real world situation we see the Z77 USB 2.0 copy times about 5% faster than X79.
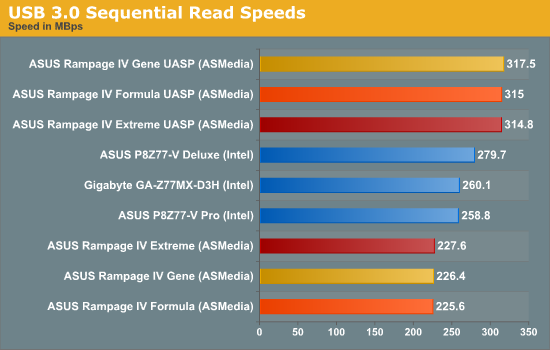
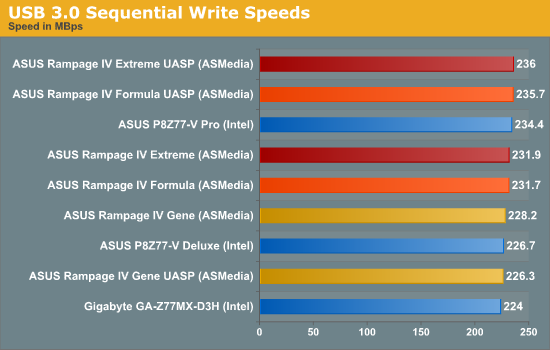
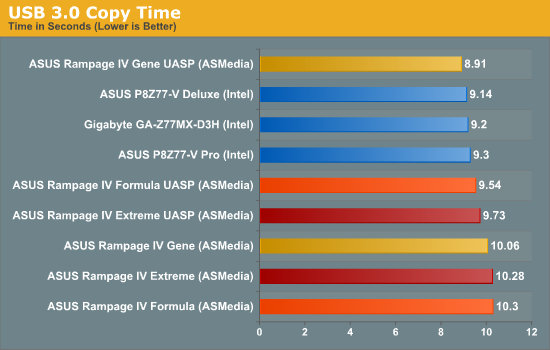
Comparing USB 3.0 speeds on X79 and Z77 platforms is akin to comparing apples and oranges. The ASMedia controller ultimately suffers overhead in read speeds, which filters down to a 10% difference in copy time. However, if one can use and abuse the UASP functionality of the ASUS motherboards, then the theoretical speeds come more into check and copy testing can at times beat the standard Intel solution on Z77.
SATA Testing
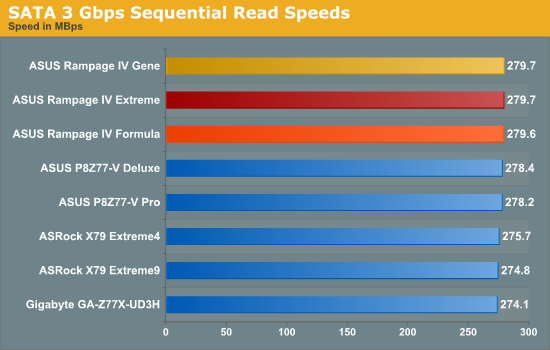
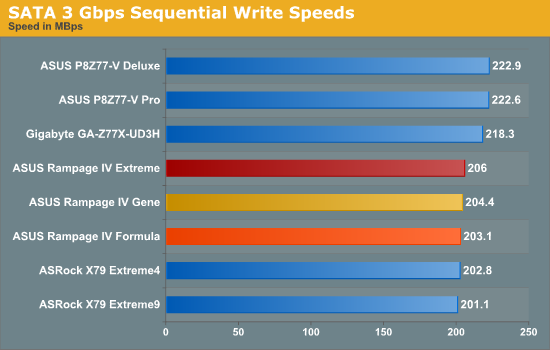
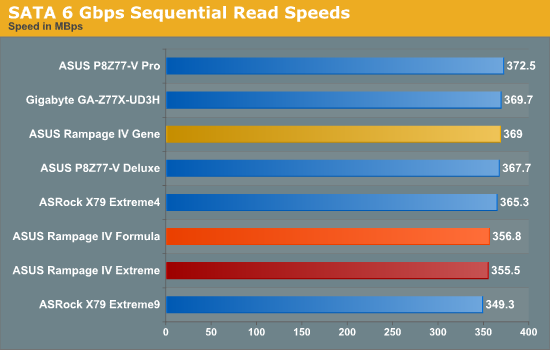
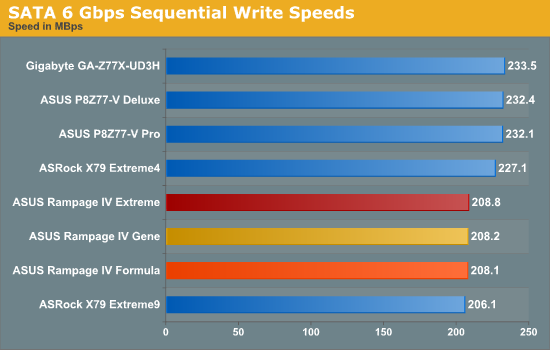
We also use CrystalDiskMark for SATA port testing on a C300 drive. The sequential test (incompressible data) is run at the 5 x 1000 MB level. This test probes the efficiency of the data delivery system between the chipset and the drive, or in the case of additional SATA ports provided by a third party controller, the efficiency between the controller, the chipset and the drive.
DPC Latency
Deferred Procedure Call latency is a way in which Windows handles interrupt servicing. In order to wait for a processor to acknowledge the request, the system will queue all interrupt requests by priority. Critical interrupts will be handled as soon as possible, whereas lesser priority requests, such as audio, will be further down the line. So if the audio device requires data, it will have to wait until the request is processed before the buffer is filled. If the device drivers of higher priority components in a system are poorly implemented, this can cause delays in request scheduling and process time, resulting in an empty audio buffer – this leads to characteristic audible pauses, pops and clicks. Having a bigger buffer and correctly implemented system drivers obviously helps in this regard. The DPC latency checker measures how much time is processing DPCs from driver invocation – the lower the value will result in better audio transfer at smaller buffer sizes. Results are measured in microseconds and taken as the peak latency while cycling through a series of short HD videos - under 500 microseconds usually gets the green light, but the lower the better.
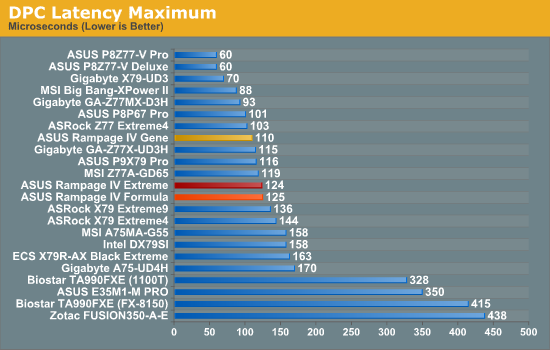
One consistent test over the past year has been our DPC testing, which can be compared as far back as our Sandy Bridge testing. All three ROG boards score 125 microseconds or less, which is still a great result – anything over 500 constitutes a bad result but most motherboards these days can hit that easily, with most coming in sub-200. Z77 and Ivy Bridge have raised the bar when it comes to DPC, but not in a way that most users will notice.
Originally published at https://www.anandtech.com/show/6082/asus-republic-of-gamers-and-x79-rog-review-rampage-iv-gene-formula-and-extreme (Wayback Machine).