
Intel NUC11TNBi5 and Akasa Newton TN Fanless Case Review: Silencing the Tiger
Power Consumption and Thermal Characteristics
The power consumption at the wall was measured with a 4K display being driven through one of the HDMI ports in the system. In the graph below, we compare the idle and load power of the Intel NUC11TNBi5 (Akasa Newton TN) with other systems evaluated before. For load power consumption, we ran the AnandTech System Stress Test (a combination of Prime95, Furmark, and the AIDA64 System Stability Test with various stress components) and noted the peak as well as idling power consumption at the wall.
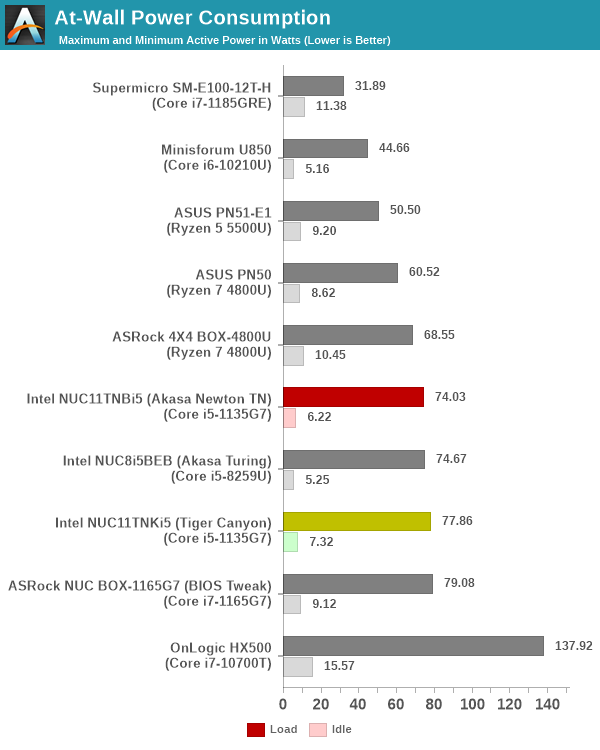
The numbers are consistent with the TDP and configured PL1 / PL2 values for the processors in the systems, and do not come as any surprise. The absence of the fan in the Newton TN build provides some idle power saving compared to the regular NUC11TNKi5.
Stress Testing
Our thermal stress routine is a combination of Prime95, Furmark, and Finalwire's AIDA64 System Stability Test. The following 9-step sequence is followed, starting with the system at idle:
- Start with the Prime95 stress test configured for maximum power consumption
- After 30 minutes, add Furmark GPU stress workload
- After 30 minutes, terminate the Prime95 workload
- After 30 minutes, terminate the Furmark workload and let the system idle
- After 30 minutes of idling, start the AIDA64 System Stress Test (SST) with CPU, caches, and RAM activated
- After 30 minutes, terminate the previous AIDA64 SST and start a new one with the GPU, CPU, caches, and RAM activated
- After 30 minutes, terminate the previous AIDA64 SST and start a new one with only the GPU activated
- After 30 minutes, terminate the previous AIDA64 SST and start a new one with the CPU, GPU, caches, RAM, and SSD activated
- After 30 minutes, terminate the AIDA64 SST and let the system idle for 30 minutes
Traditionally, this test used to record the clock frequencies - however, with the increasing number of cores in modern processors and fine-grained clock control, frequency information makes the graphs cluttered and doesn't contribute much to understanding the thermal performance of the system. The focus is now on the power consumption and temperature profiles to determine if throttling is in play. All the thermal stress tests reported in this section were conducted with the ambient temperature between 78F and 82F and no explicit airflow across the system under test.
The first set of graphs is for the actively-cooled Intel NUC11TNKi5. Starting off with the temperatures and fan speed, we see that the package briefly reaches 92C during the initial PL2 bursts. However, the fan kicks up to 3500 RPM and soon cools it down to around 70C. For regular PL1 loading, the fan stays at around 3150 RPM. The maximum sustained temperature for the package was recorded during the AIDA64 CPU, FPU, caches, and RAM stress - around 83C. The maximum SSD temperature was recorded to be around 65C during the AIDA64 SSD stress component.
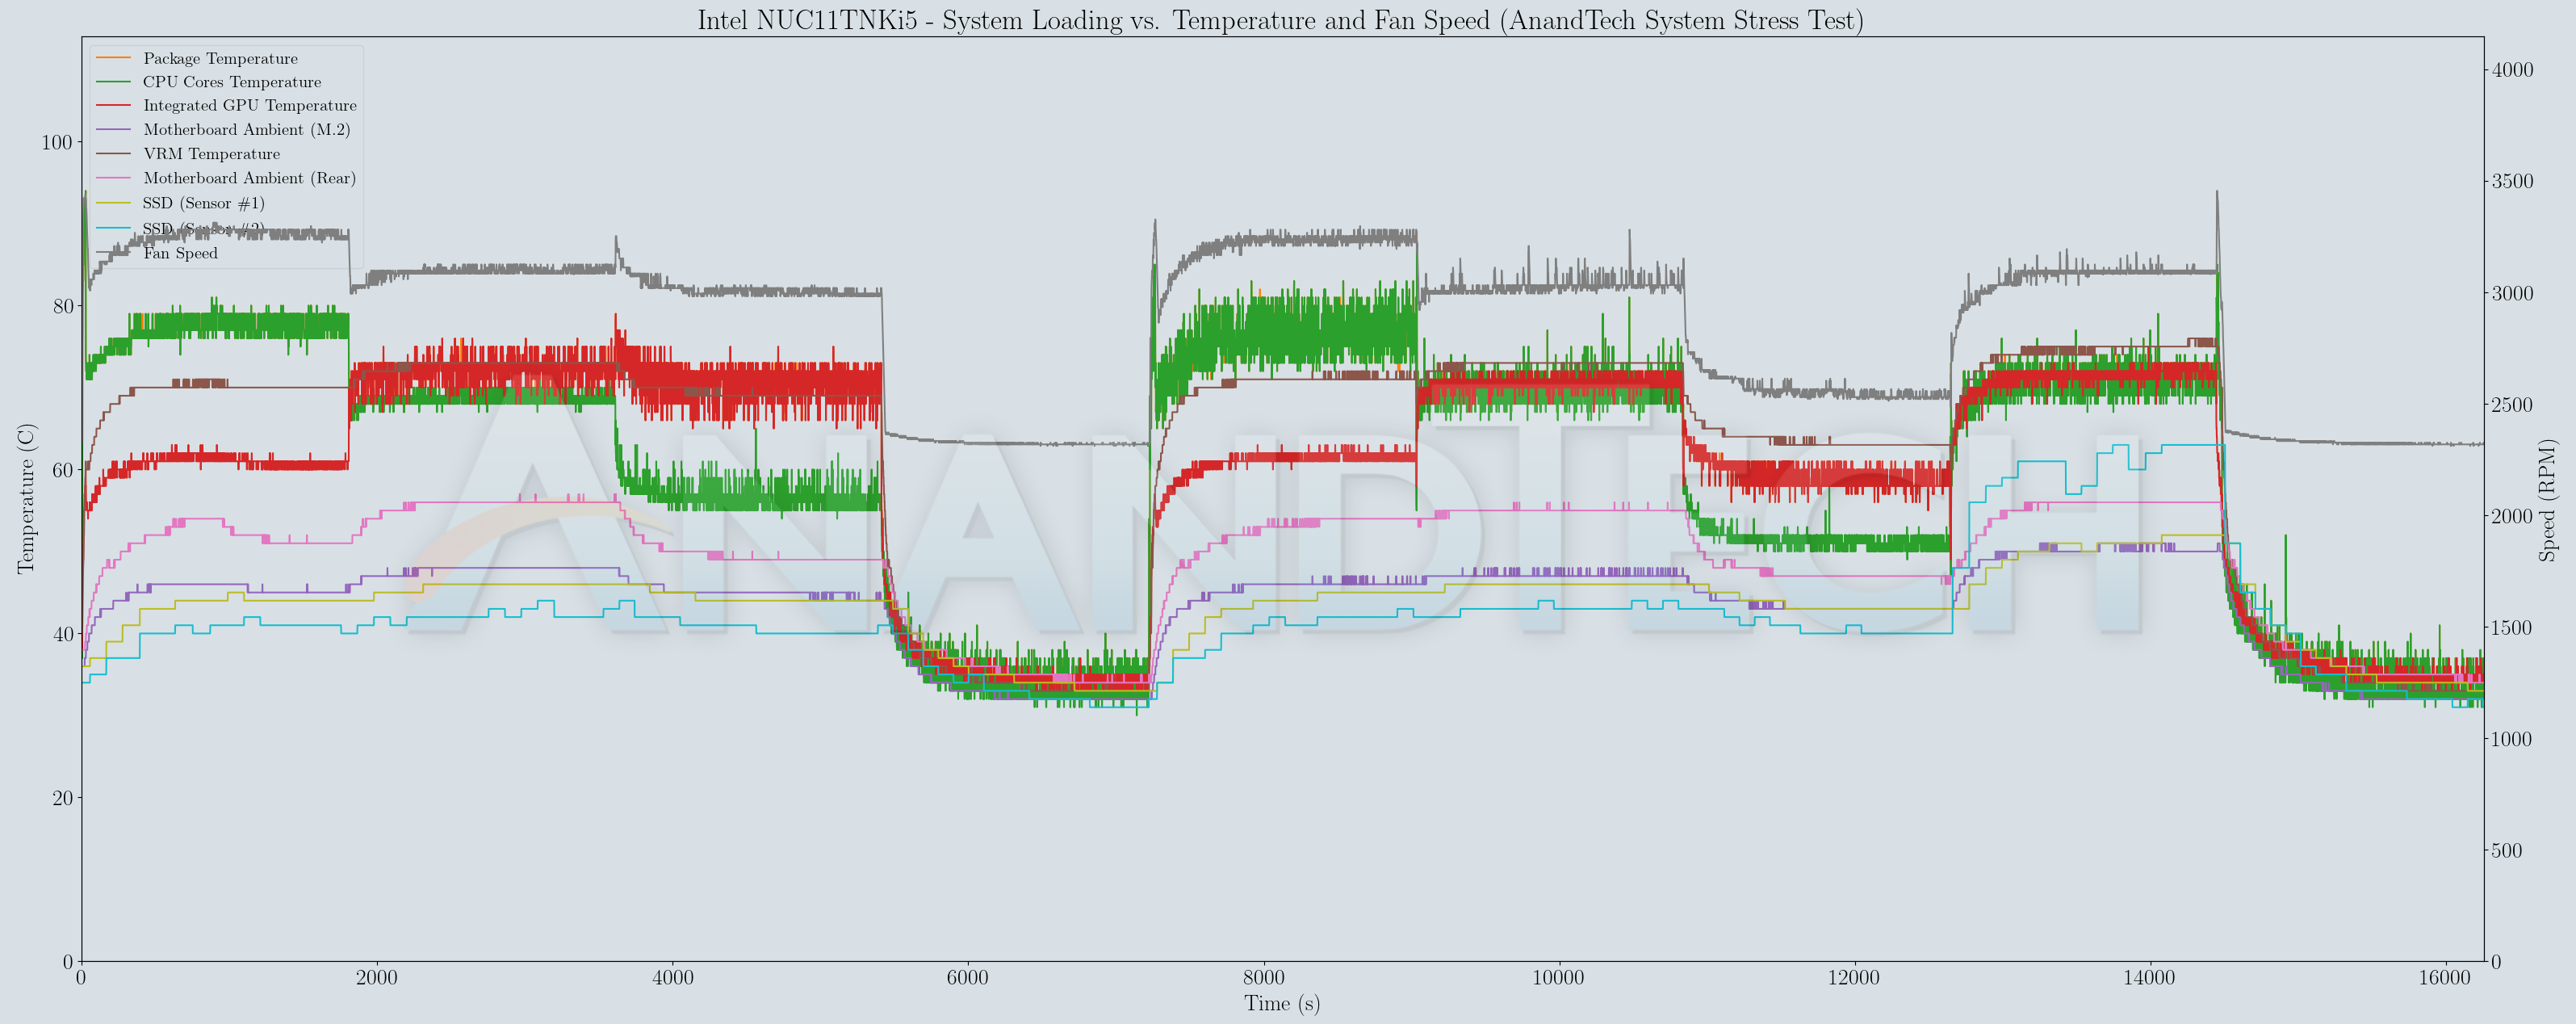
Based on the temperatures recorded above, we do not expect to see any throttling in the picture. This is confirmed by the power numbers reported for the internal components, as well as the at-wall power consumption number.
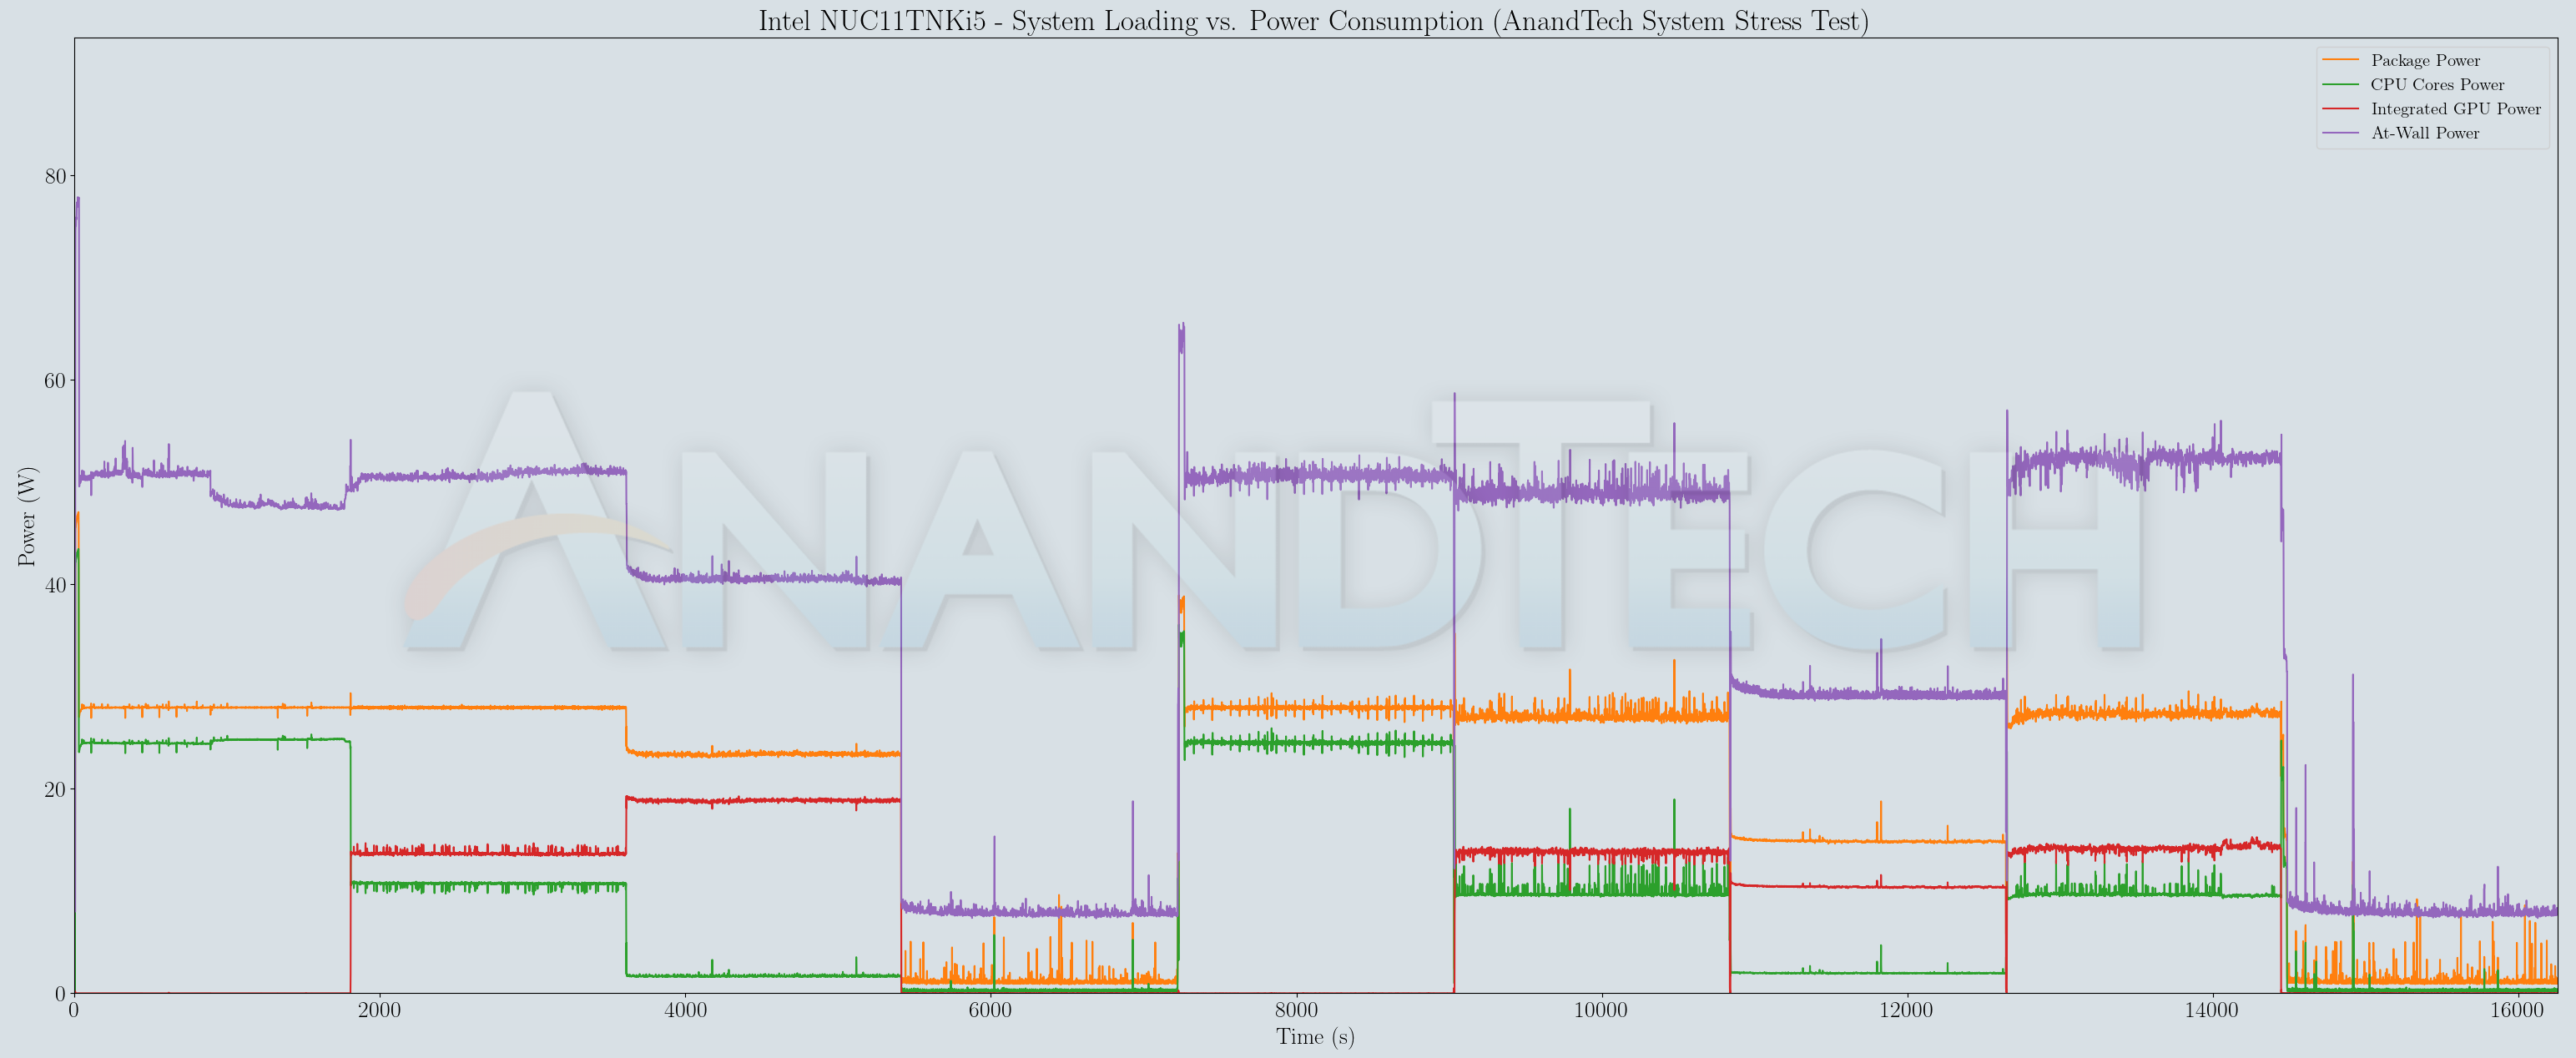
In regions of pure CPU stress, the package power consumption is 28W right through. Addition of workload components like GPU and SSD stressing reduces this number somewhat as CPU cycles are spent controlling those peripherals also. For the GPU in particular, the power balance budgeting between the CPU and the GPU comes into play and prevents the full 28W capacity from being utilized. The maximum allowed GPU power consumption appears to be around 18W.
A similar stress sequence was applied to the Newton TN build. Analyzing the temperature graph first, a spike to 90C+ is seen in the beginning. However, the ramp up of the temperature during the Prime95 component is much steeper than the actively cooled version. The temperature during the Furmark-only segment reaches around 94C, but was still short of the junction temperature (105C). On the other hand, during first AIDA64 SST stress segment, the temperatures seemed to touch 102C and was still ramping up when the 30 minutes allotted to the segment had elapsed. While the VRM circuitry remained under safe limits (a maximum of 92C and stabilized), the SSD hit 86C during the stress test.
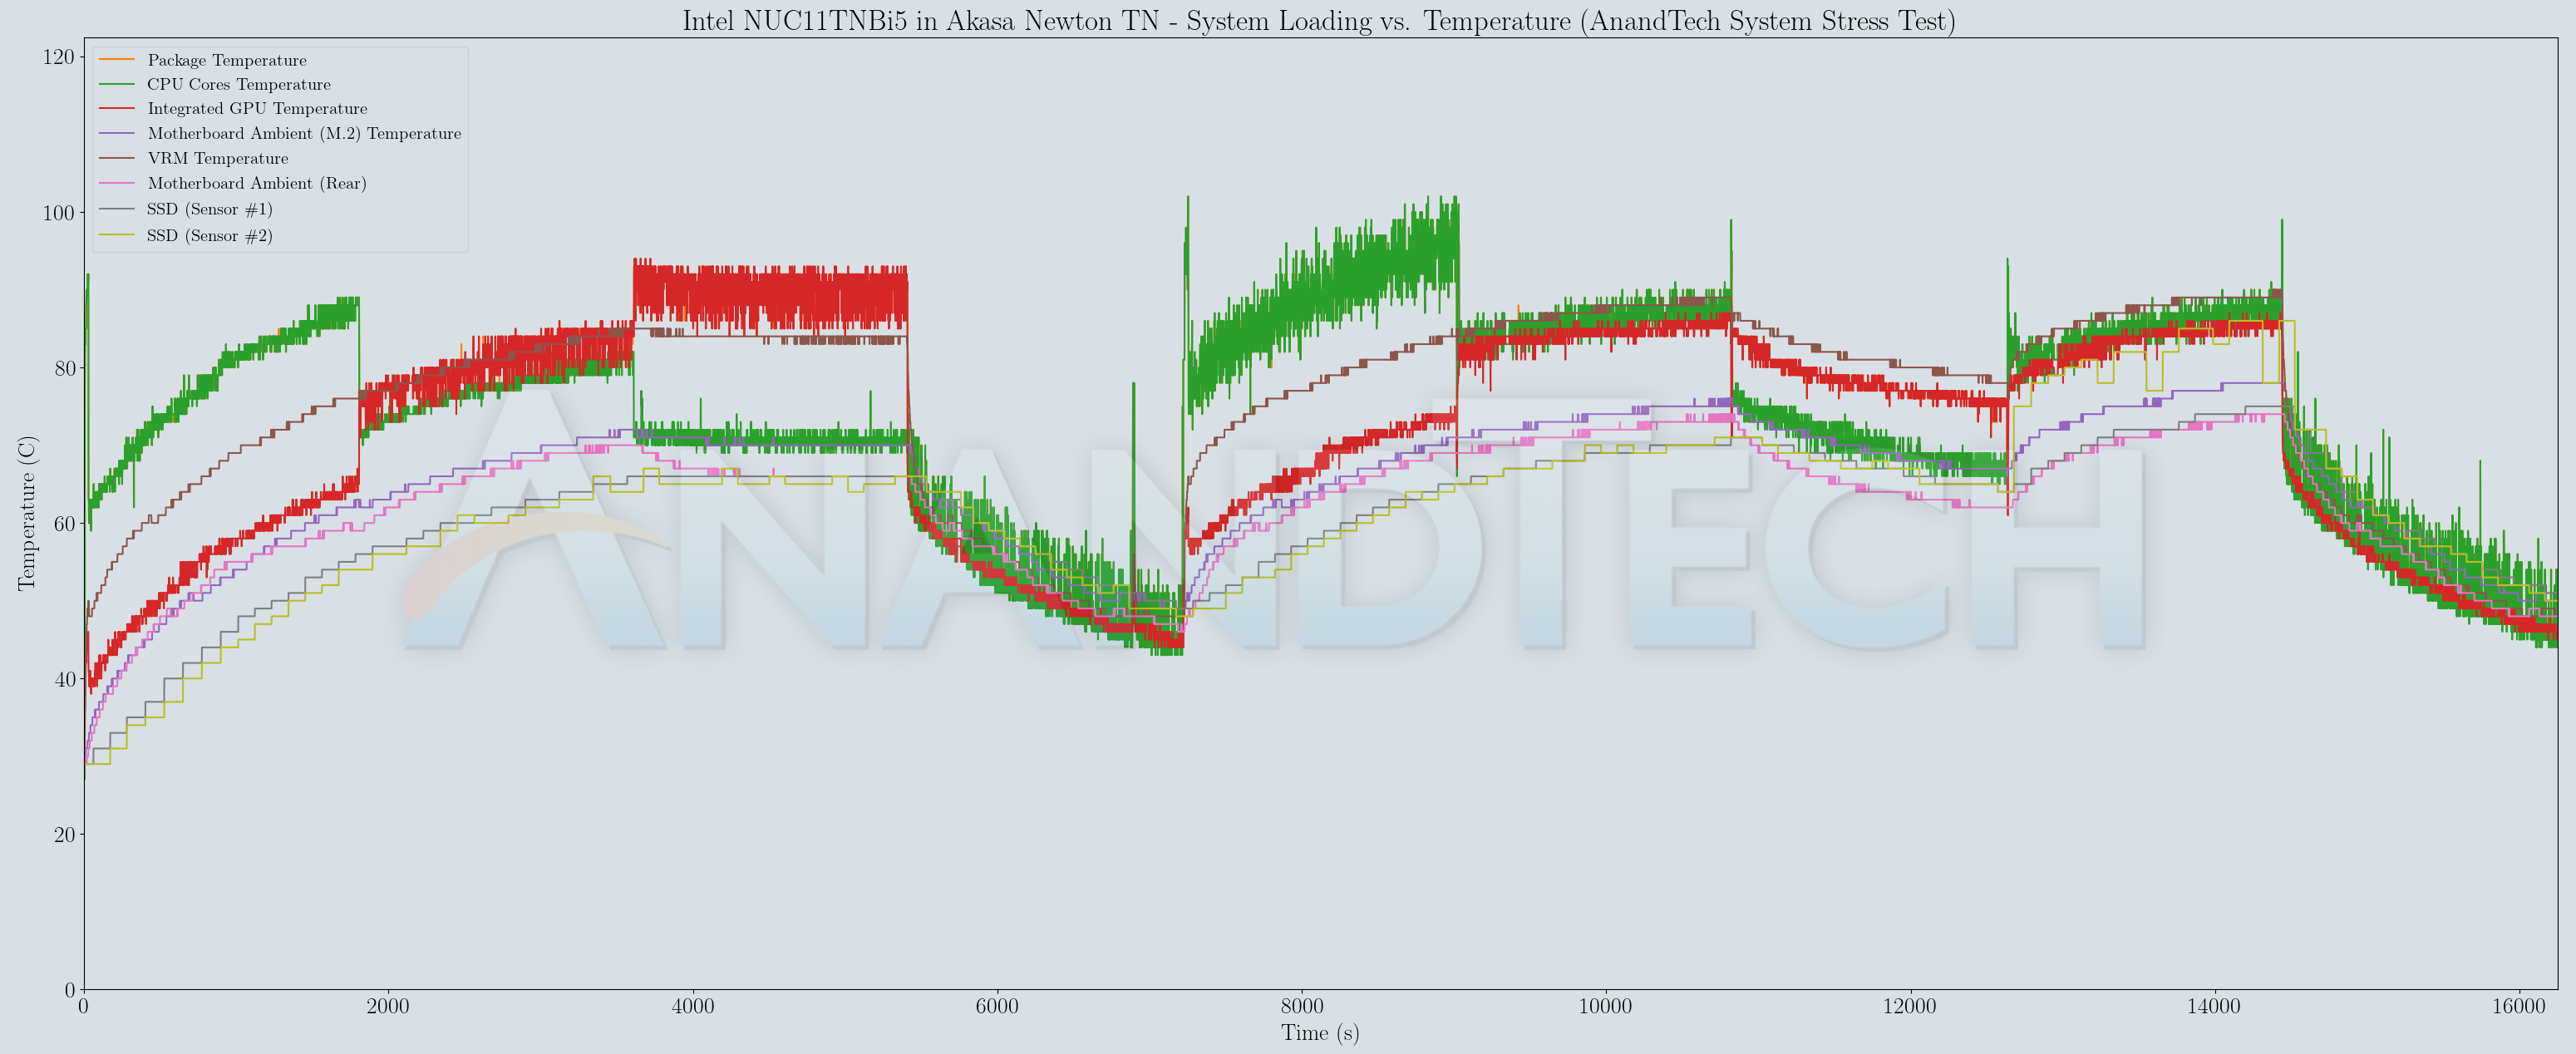
The temperatures recorded above appear to get stabilized within 30 minutes for all workloads except the AIDA64 SST's first segment. In this context, the package power numbers would be interesting to analyze. We look at the collected power numbers below.
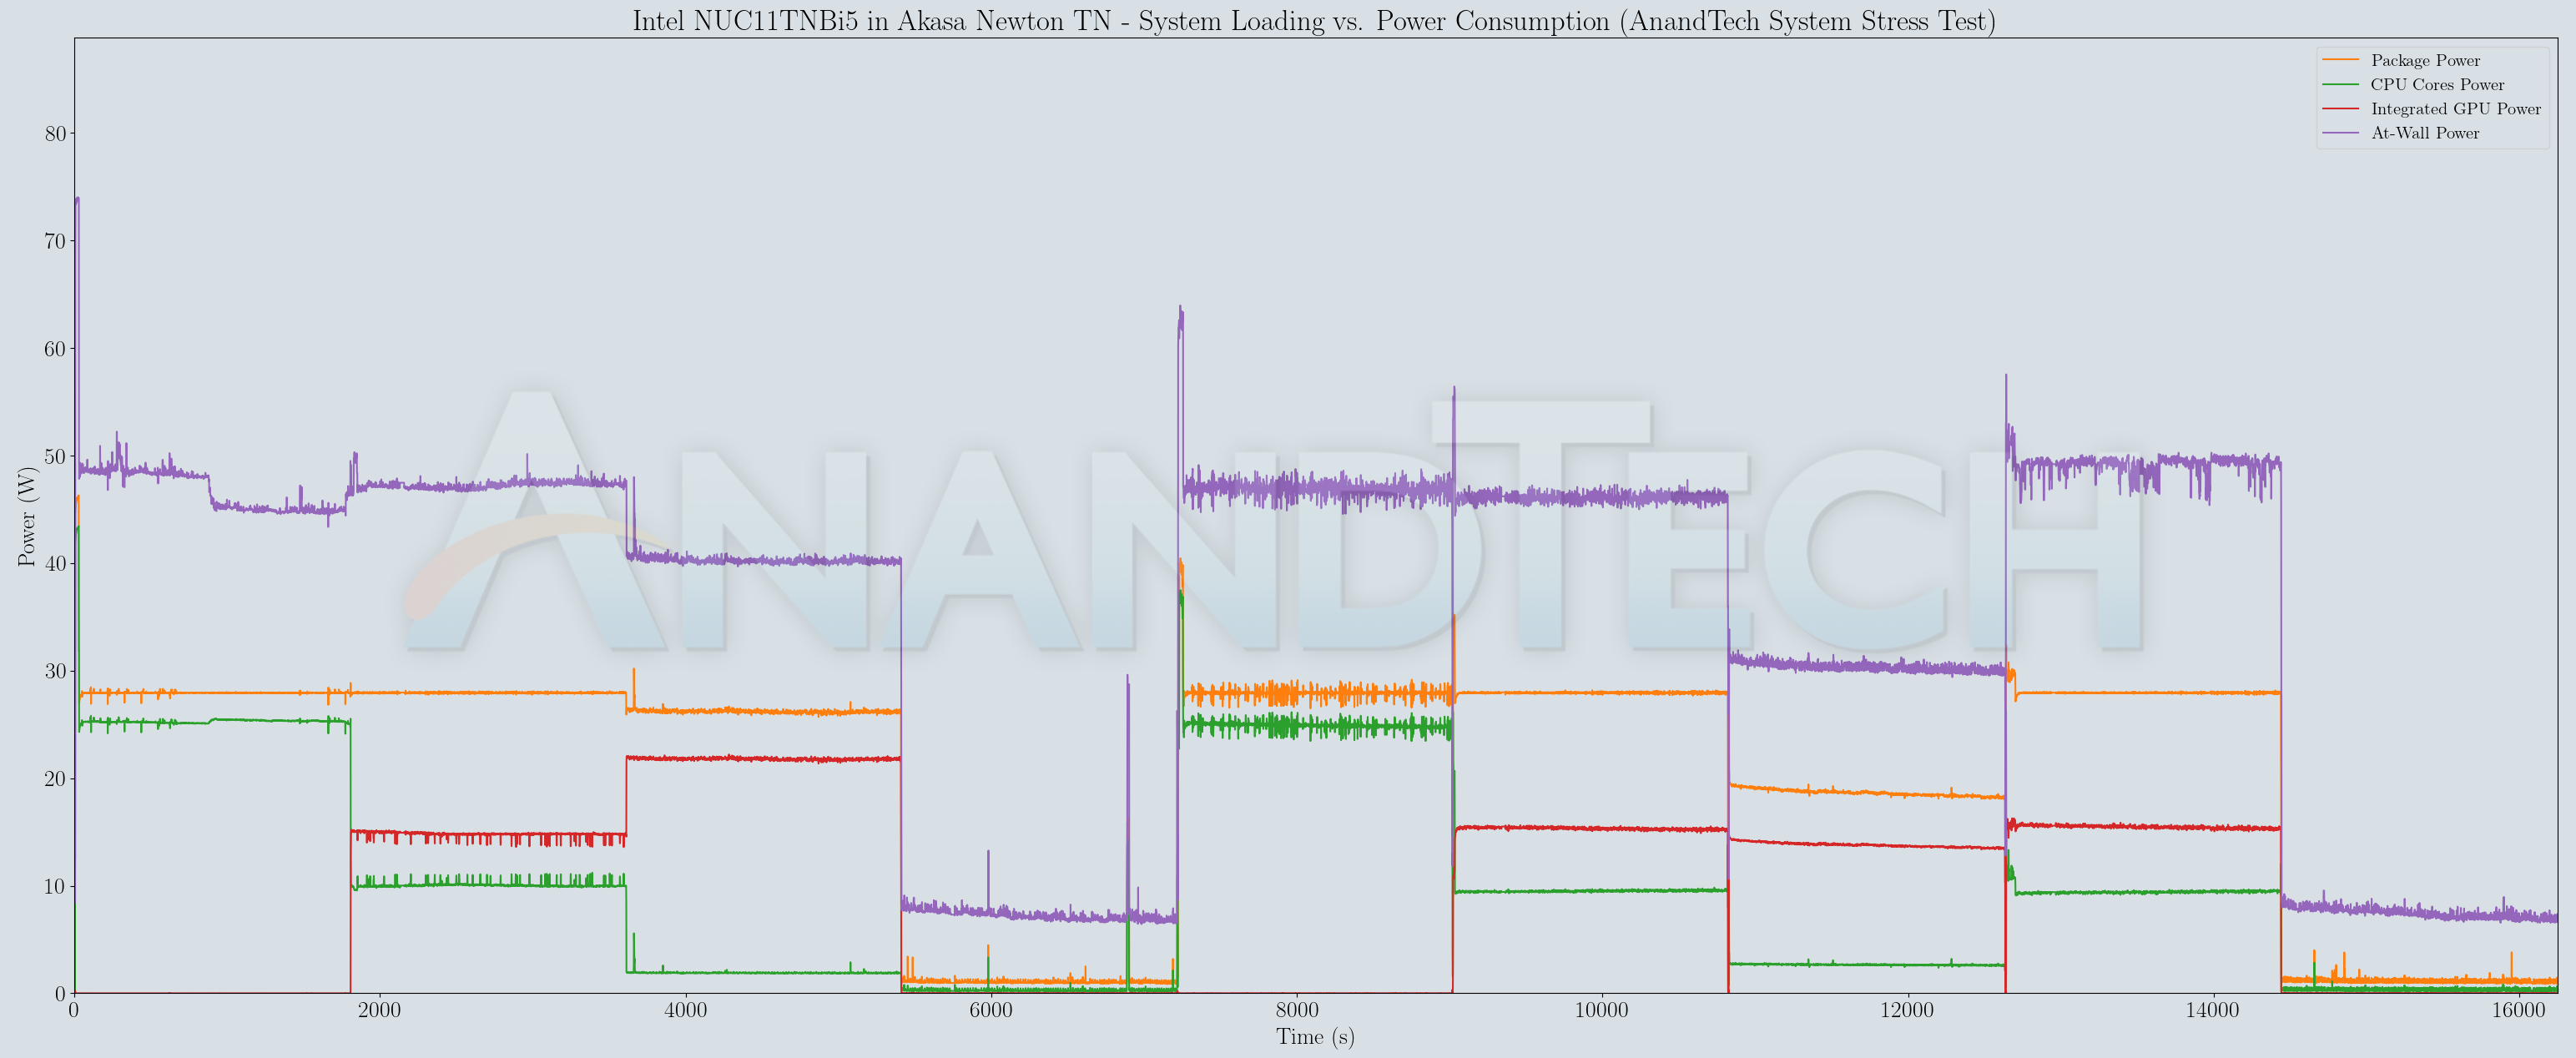
The power numbers reveal interesting aspects. The package power numbers for simultaneous Prime95 and Furmark remains solid at 28W, but the package temperature had started flattening around 86C. On the other hand, the first segment of AIDA64 SST also has a package power of 28W, but the temperature peak was 102C, and was still ramping up after 30 minutes. It appears that the case would eventually throttle the CPU assuming an extended duration for this stress segment. To analyze this further, we configured the segment to run alone for 4 hours while recording the same parameters.
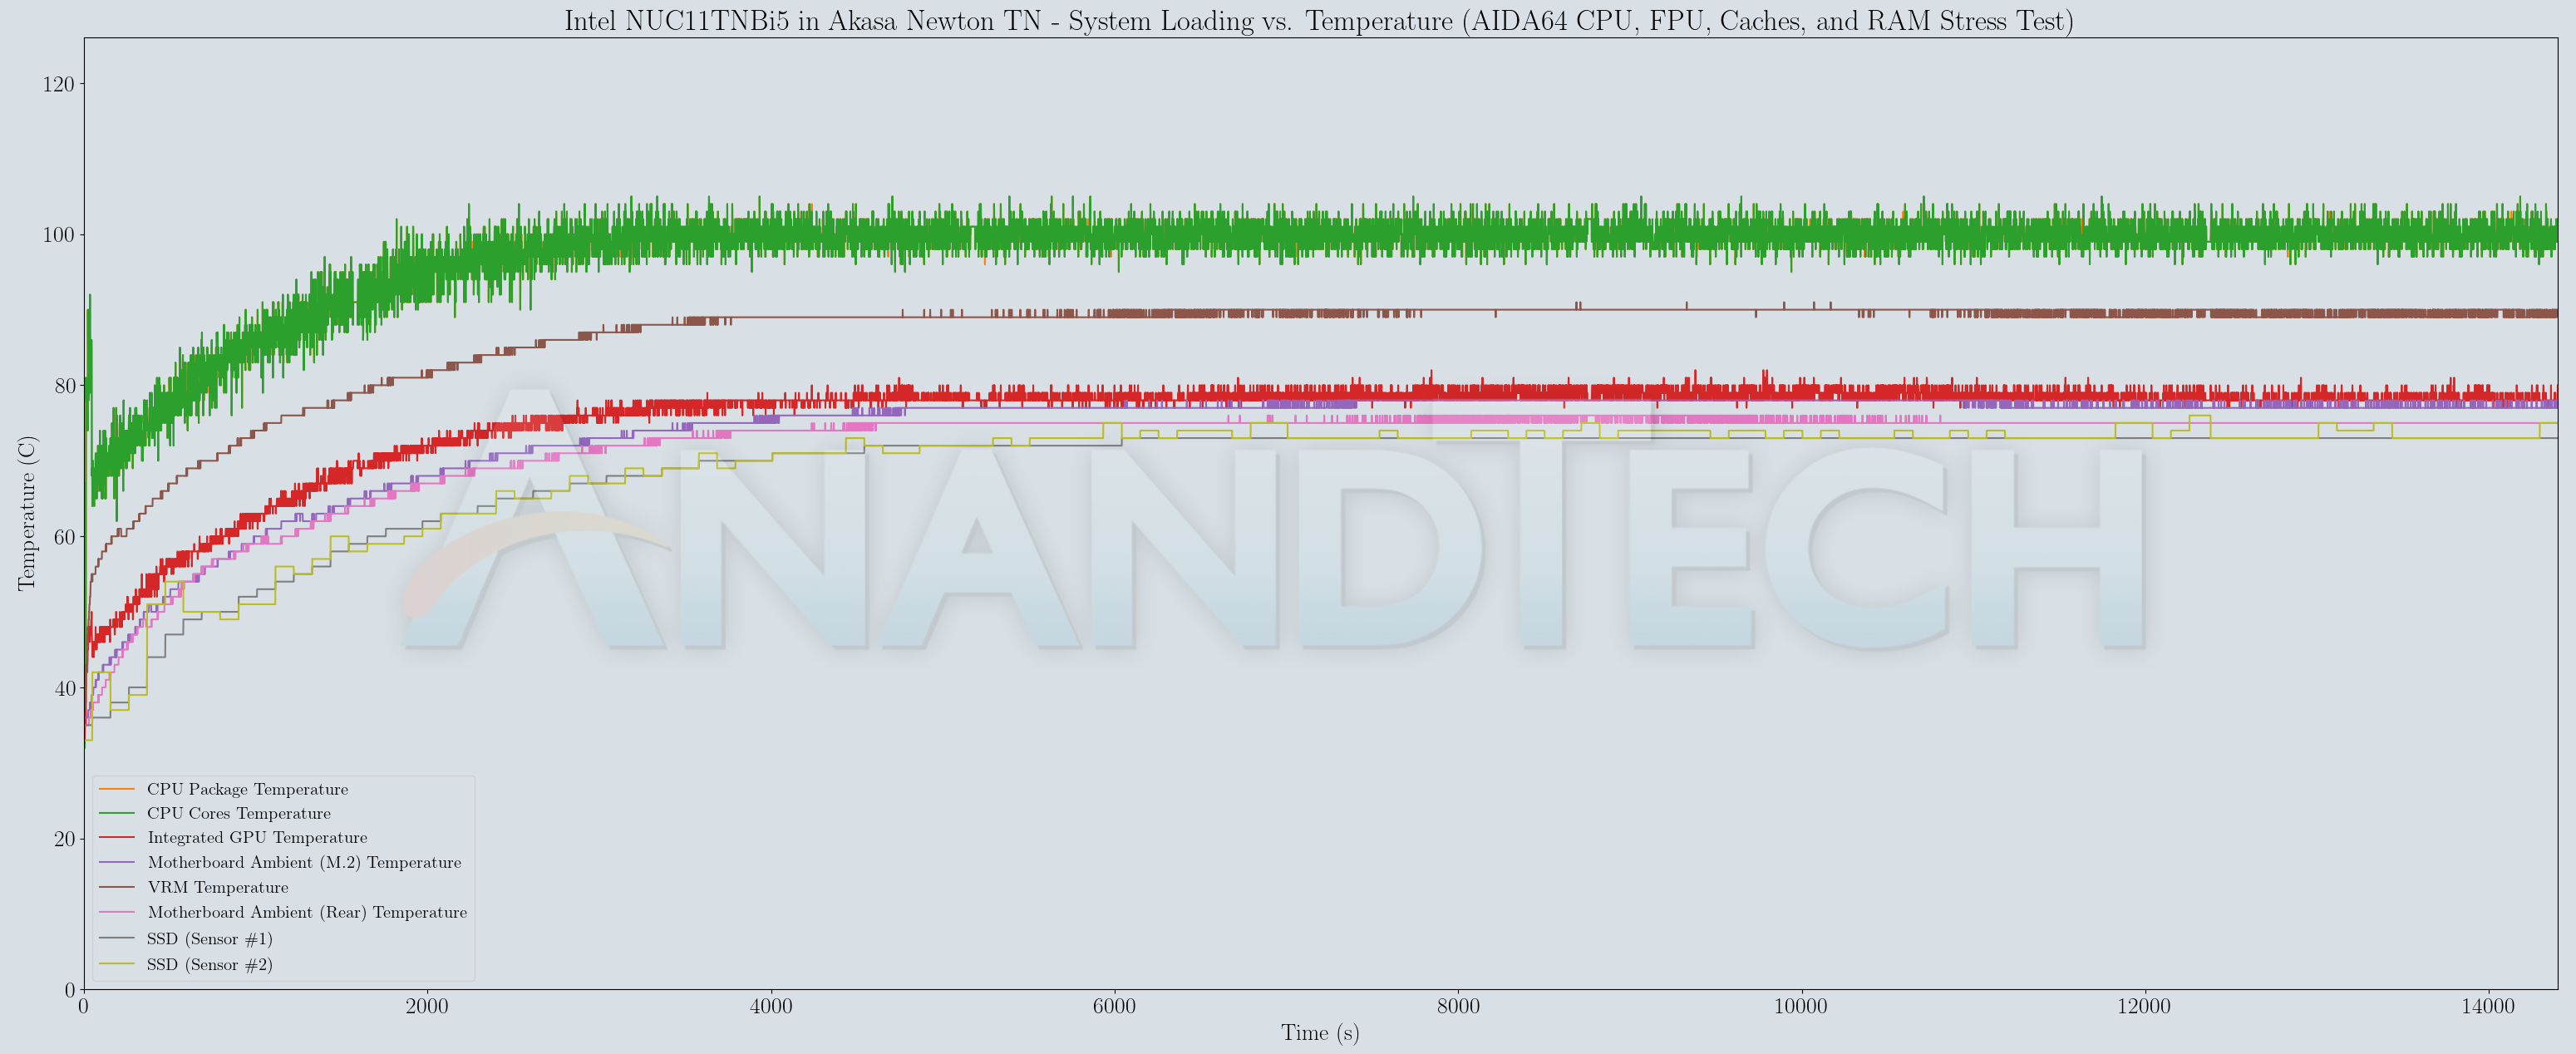
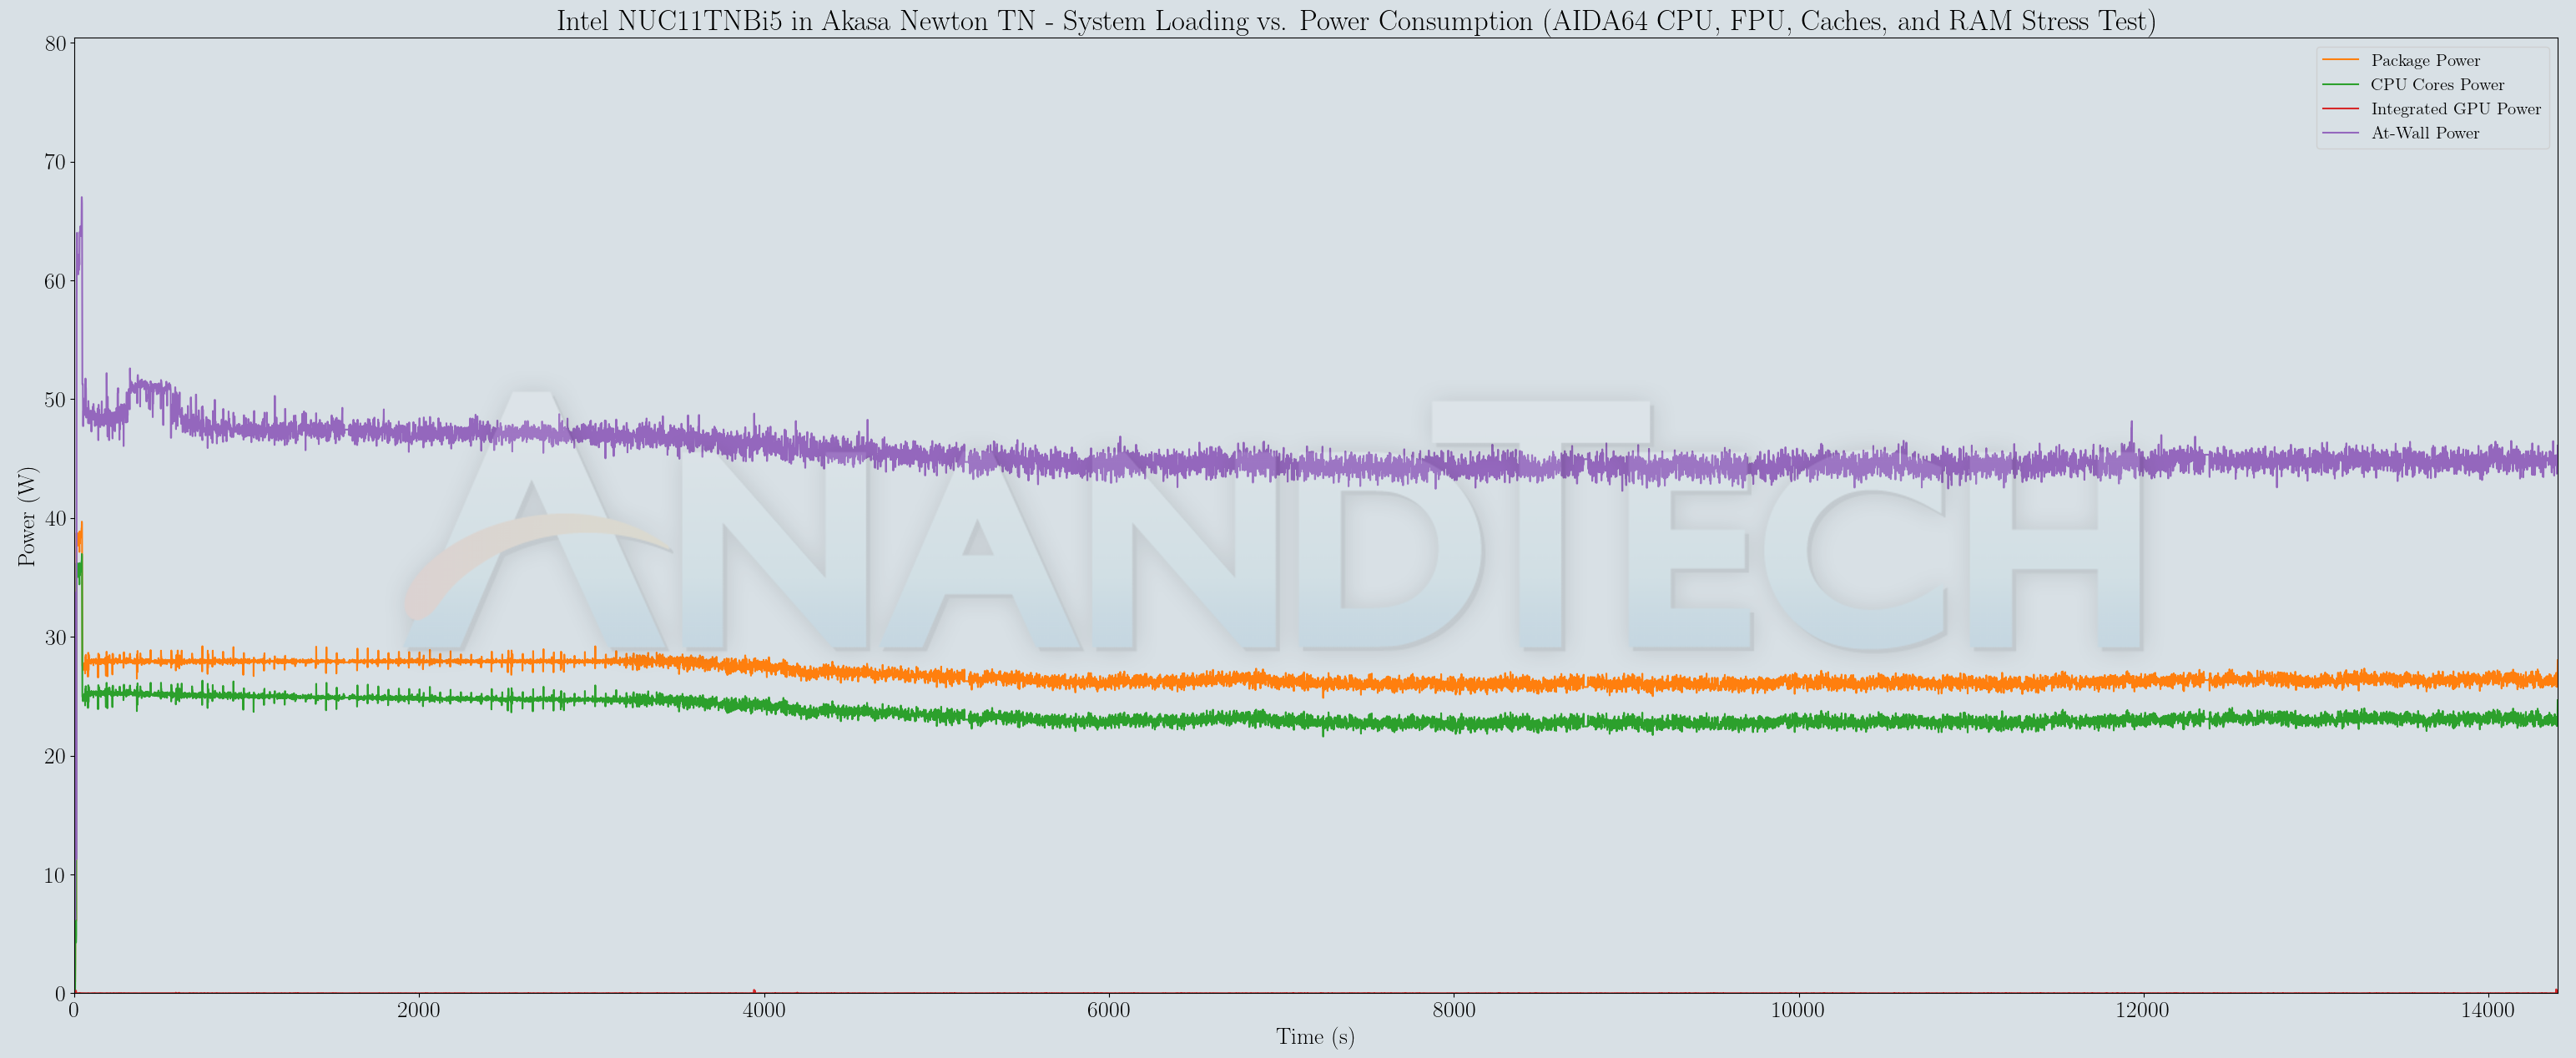
As expected, the junction temperature (105C) was hit around 1 hour into the stress test and throttling kicked in to drop the package power and keep the package temperature around 100C. The package temperature oscillated between 25W and 26W during this duration. As an additional experiment, we repeated the same stress test after setting the PL1 limit to 25W in the BIOS.
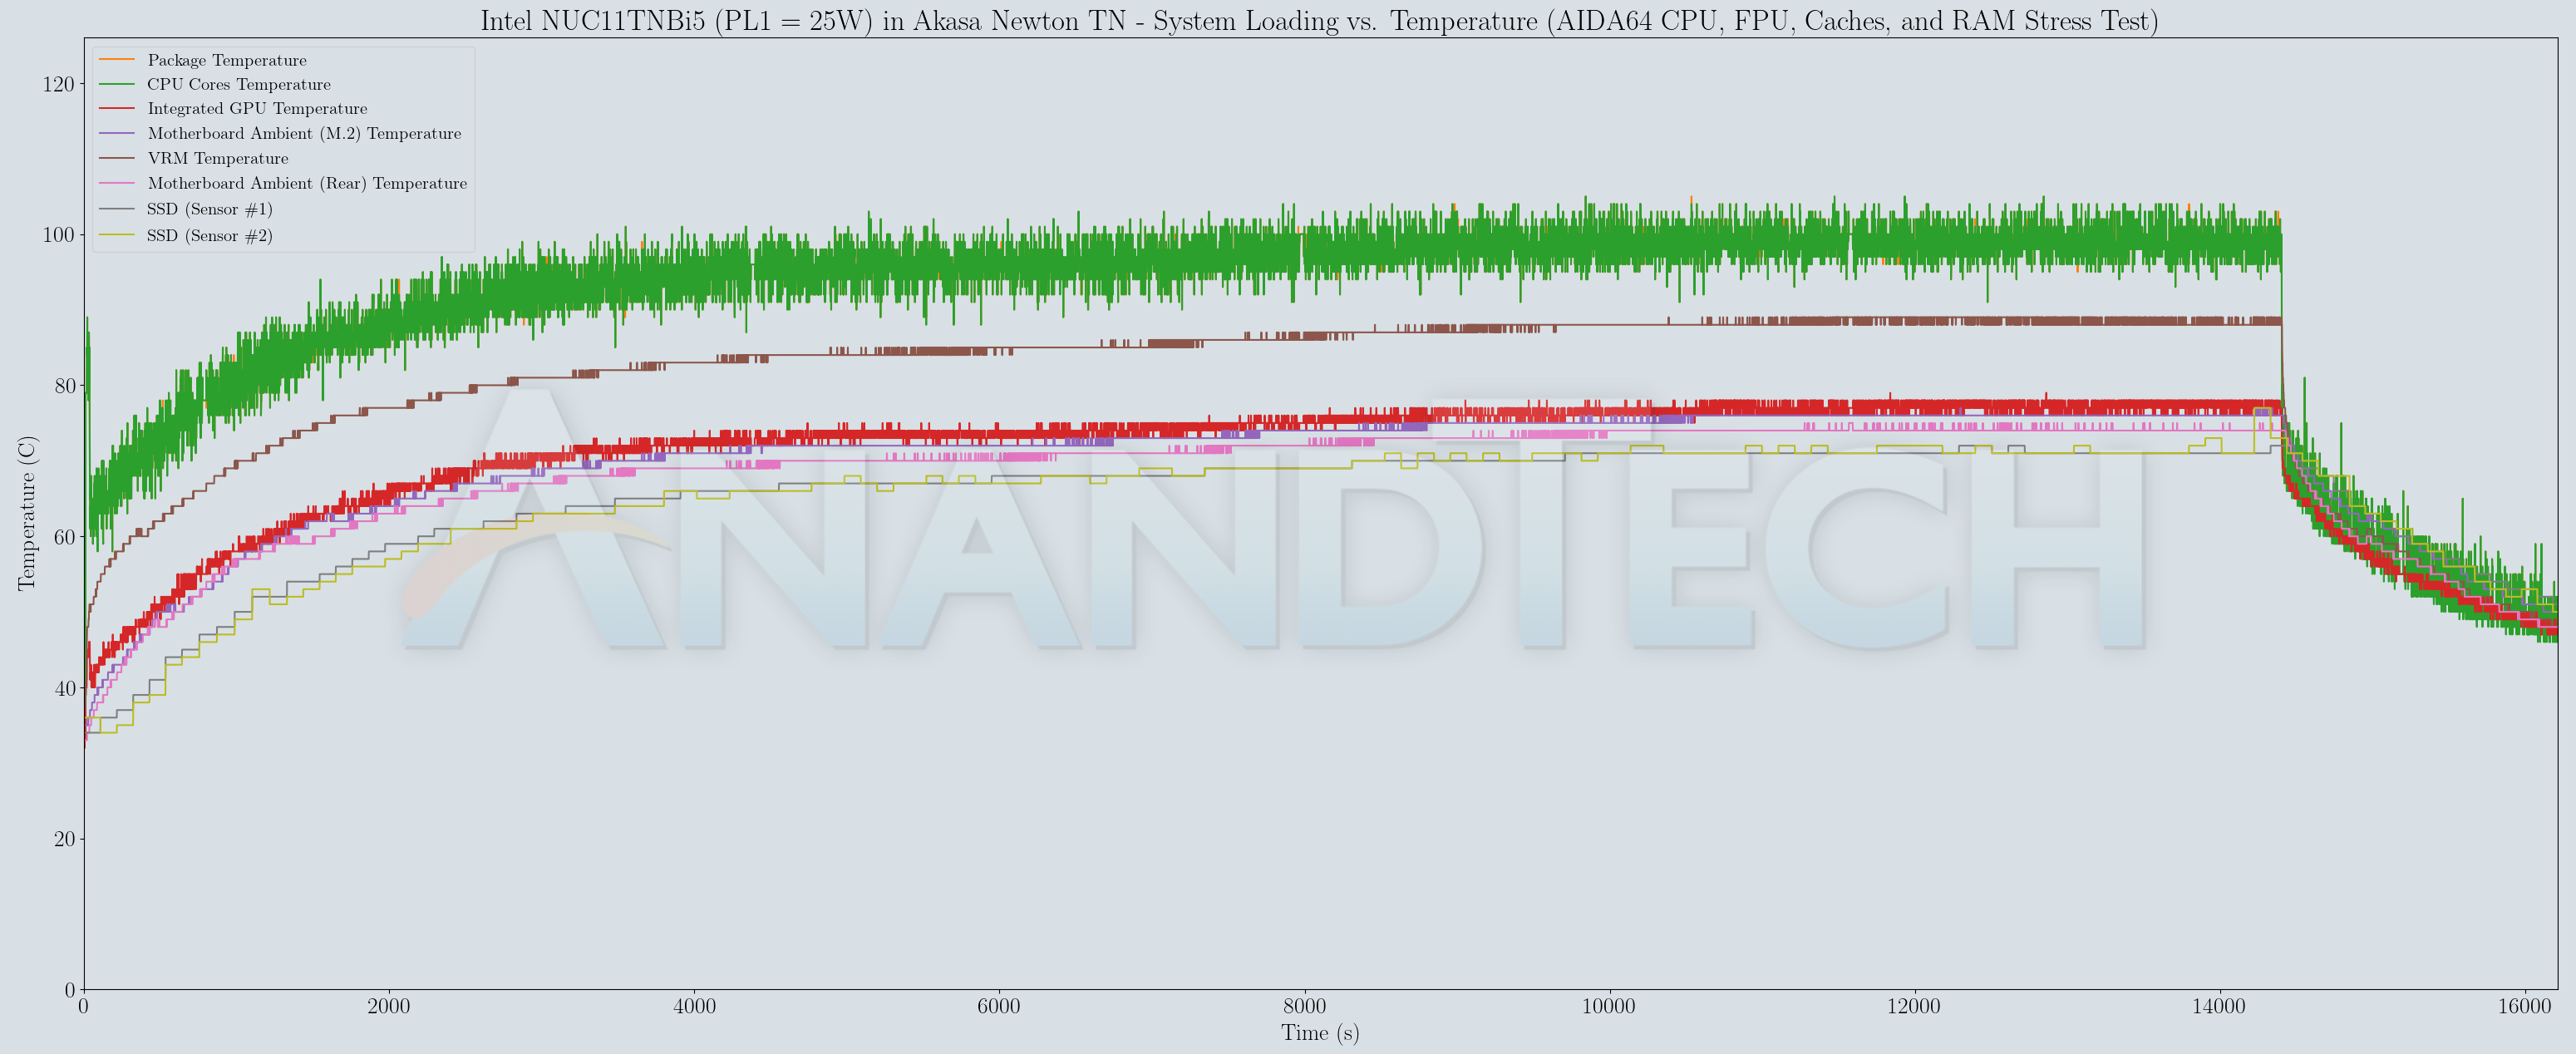
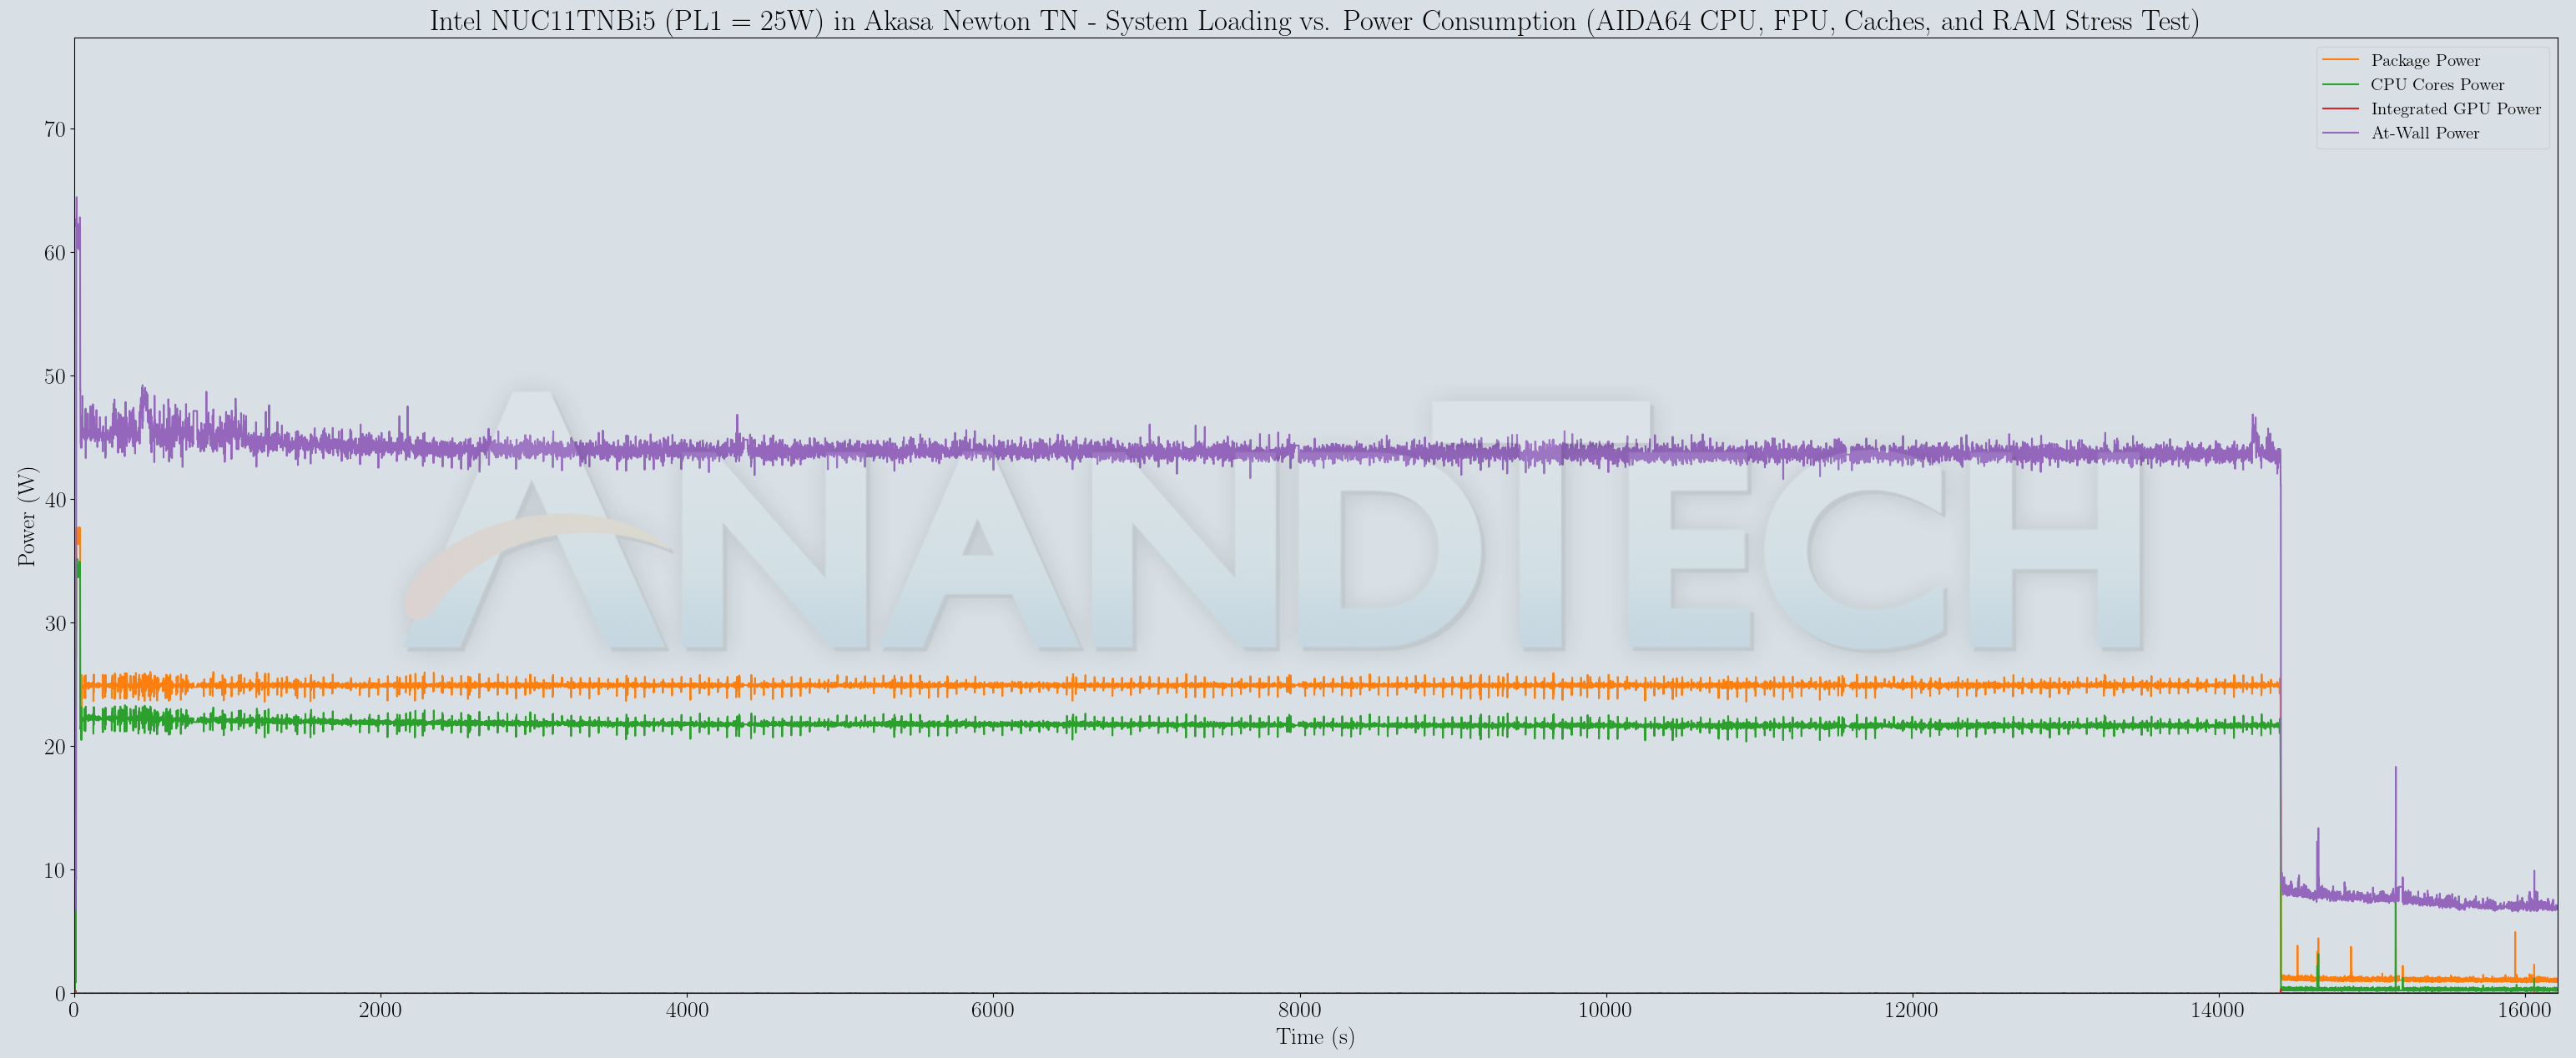
Unfortunately, even with a PL1 of 25W, the junction temperature was still hit around 165 minutes into the test. This indicates that the problem is not one of handling a 28W TDP - rather it is an issue of drawing away the heat from a particular hot spot on the package that is triggered explicitly by the AIDA64 CPU, FPU, Caches, and RAM stress test.
Thermal Profile
One of the key aspects of fanless systems is the thermal profile under load. Our stress test saw the internal package temperature go as high as 105C. However, even with the package temperature oscillating around that mark, the highest temperature we recorded deep inside one of the ridges was just 70C. A FLIR One Pro thermal camera was used for this purpose.
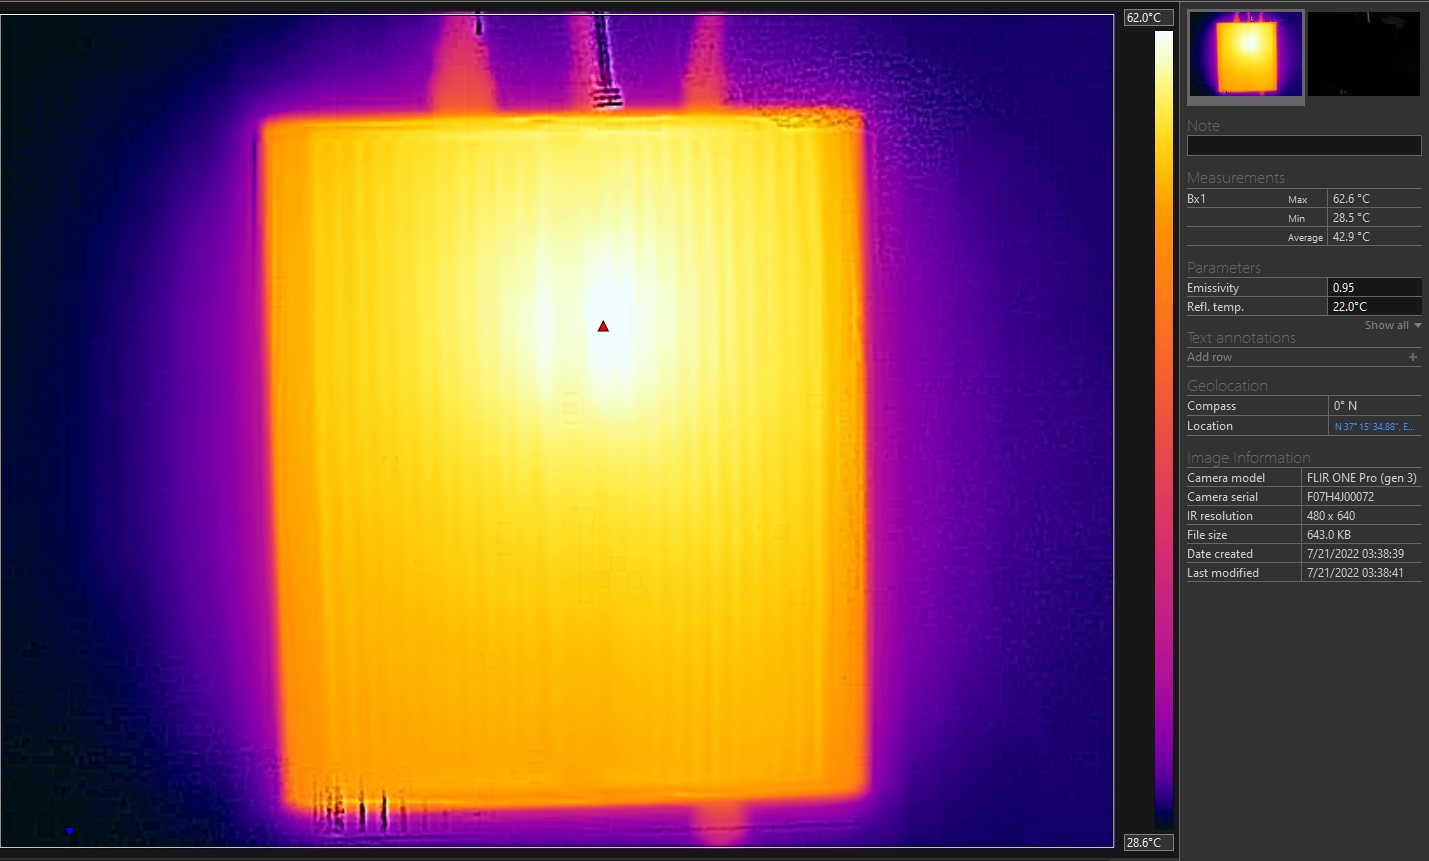
The gallery below presents some of the other thermal pictures gathered during the course of the four hour stress test which managed to hit the junction temperature. The numbers in the pictures show that the chassis is not heat saturated.


The case itself is more than capable of handling a 28W TDP processor. However, that is only half the story. On both the processor package and SSD fronts, it is disappointing to see that the solution is not able to draw heat away quick enough for specific workloads. Eventually, throttling is forced to come into the picture.
Originally published at https://www.anandtech.com/show/17502/intel-nuc11tnbi5-and-akasa-newton-tn-fanless-case-review-silencing-the-tiger (Wayback Machine).