
The Kingston A1000 NVMe SSD Review: Phison E8 Revisited
Random Read Performance
Our first test of random read performance uses very short bursts of operations issued one at a time with no queuing. The drives are given enough idle time between bursts to yield an overall duty cycle of 20%, so thermal throttling is impossible. Each burst consists of a total of 32MB of 4kB random reads, from a 16GB span of the disk. The total data read is 1GB.
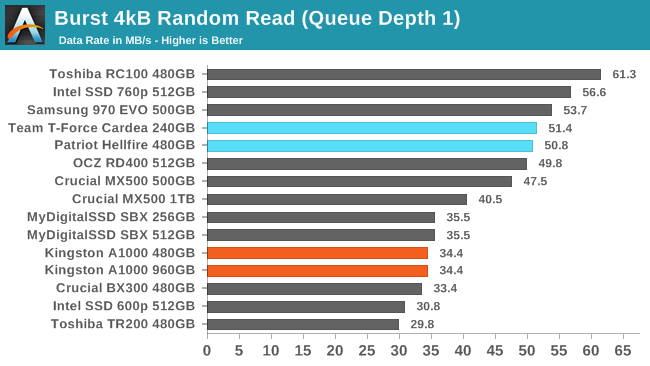
The burst random read performance of the Kingston A1000 is slightly lower than that of the MyDigitalSSD SBX, and barely half that of the Toshiba RC100, both of which use the same NAND flash memory as the A1000. The older Phison E7 drives with MLC NAND are only a little bit slower than the fastest current-generation SSDs.
Our sustained random read performance is similar to the random read test from our 2015 test suite: queue depths from 1 to 32 are tested, and the average performance and power efficiency across QD1, QD2 and QD4 are reported as the primary scores. Each queue depth is tested for one minute or 32GB of data transferred, whichever is shorter. After each queue depth is tested, the drive is given up to one minute to cool off so that the higher queue depths are unlikely to be affected by accumulated heat build-up. The individual read operations are again 4kB, and cover a 64GB span of the drive.
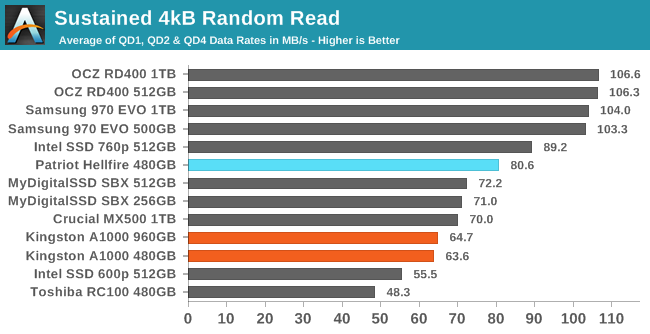
On the longer random read test, the A1000's performance shortfall relative to the SBX is even wider, and the A1000 is one of the slowest current-generation NVMe drives on this test. The Toshiba RC100's performance is in last place, because the sustained random read test covers a larger portion of the drive than the RC100's host memory buffer is set up to cache metadata for.
 |
|||||||||
| Power Efficiency in MB/s/W | Average Power in W | ||||||||
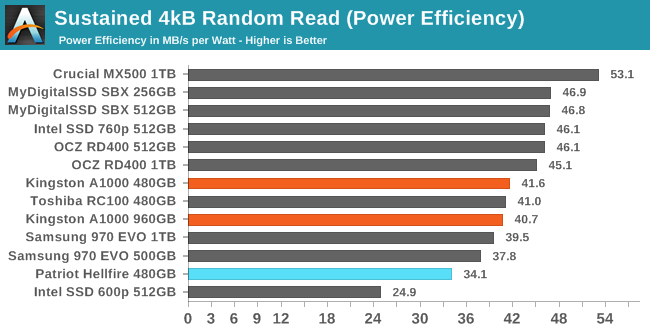
The power consumption of the Kingston A1000 during random reads is only slightly higher than the SBX, but since performance is also worse that adds up to a clear efficiency gap. The SBX is in the top tier of flash-based NVMe SSDs for efficiency on this test, and the A1000 is in the second tier. The older Phison E7-based Patriot Hellfire performed reasonably, but was quite power hungry in comparison to today's drives.
 |
|||||||||
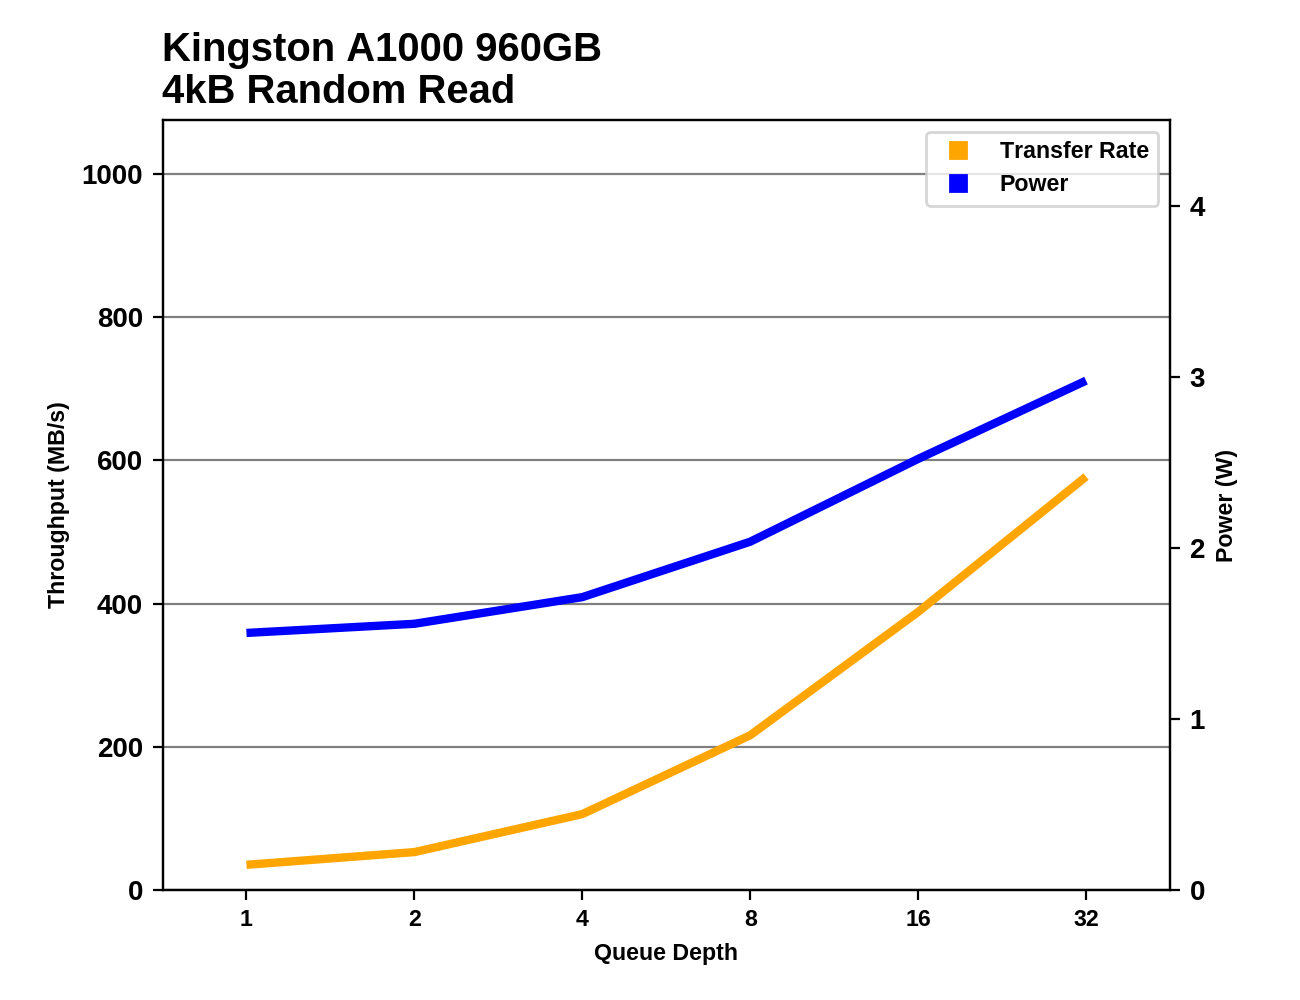
The random read performance of the Kingston A1000 shows very good scaling as queue depth increases, though it never manages to catch up to recent high-end NVMe SSDs. However, the sub-par performance at low queue depths is far more important to everyday usage.
Random Write Performance
Our test of random write burst performance is structured similarly to the random read burst test, but each burst is only 4MB and the total test length is 128MB. The 4kB random write operations are distributed over a 16GB span of the drive, and the operations are issued one at a time with no queuing.
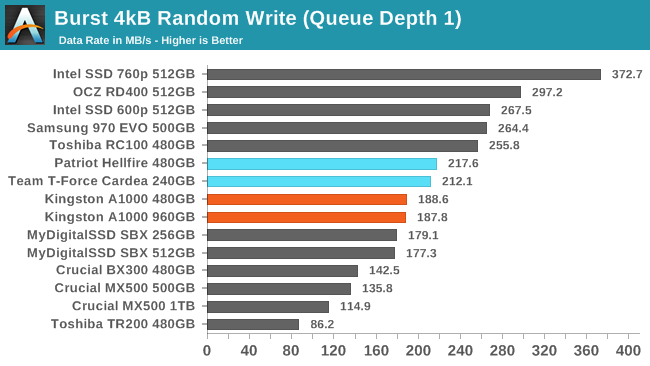
The burst random write performance of the Kingston A1000 is slightly better than the MyDigitalSSD SBX, but both are still behind almost all current NVMe SSDs. The Phison E7 drives with MLC NAND are a bit faster than the A1000 and SBX, so the newer drives are a step backwards in spite of the addition of SLC write caching.
As with the sustained random read test, our sustained 4kB random write test runs for up to one minute or 32GB per queue depth, covering a 64GB span of the drive and giving the drive up to 1 minute of idle time between queue depths to allow for write caches to be flushed and for the drive to cool down.
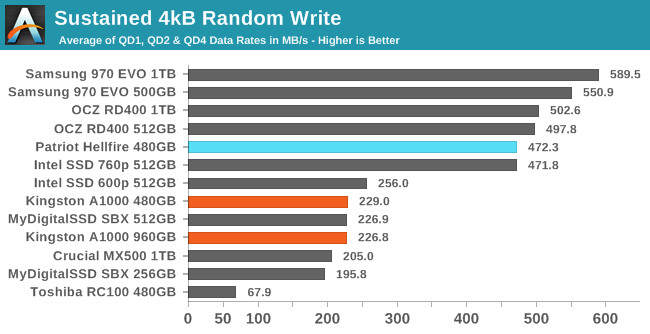
Aside from the Toshiba RC100 falling to last place, nothing looks better for the Kingston A1000 on the longer random write test. The sustained random write performance of the A1000 or the SBX is less than half that of a high-end NVMe SSD.
 |
|||||||||
| Power Efficiency in MB/s/W | Average Power in W | ||||||||
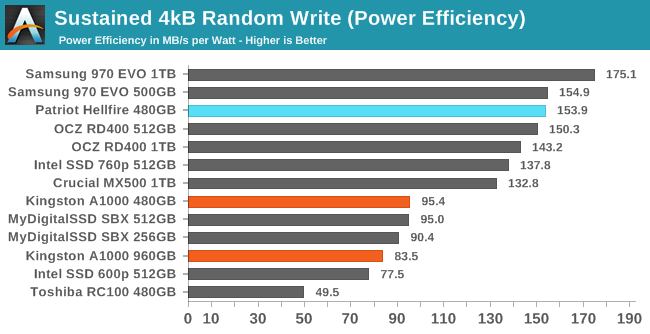
The 960GB A1000 requires significantly more power during the sustained random write test than the 480GB model, but it offers essentially the same performance, so the larger A1000 has a lower efficiency score. All of the Phison E8 drives fare poorly on this metric compared to high-end NVMe SSDs and good SATA SSDs, but it's not quite the factor of two spread that the raw performance shows.
 |
|||||||||
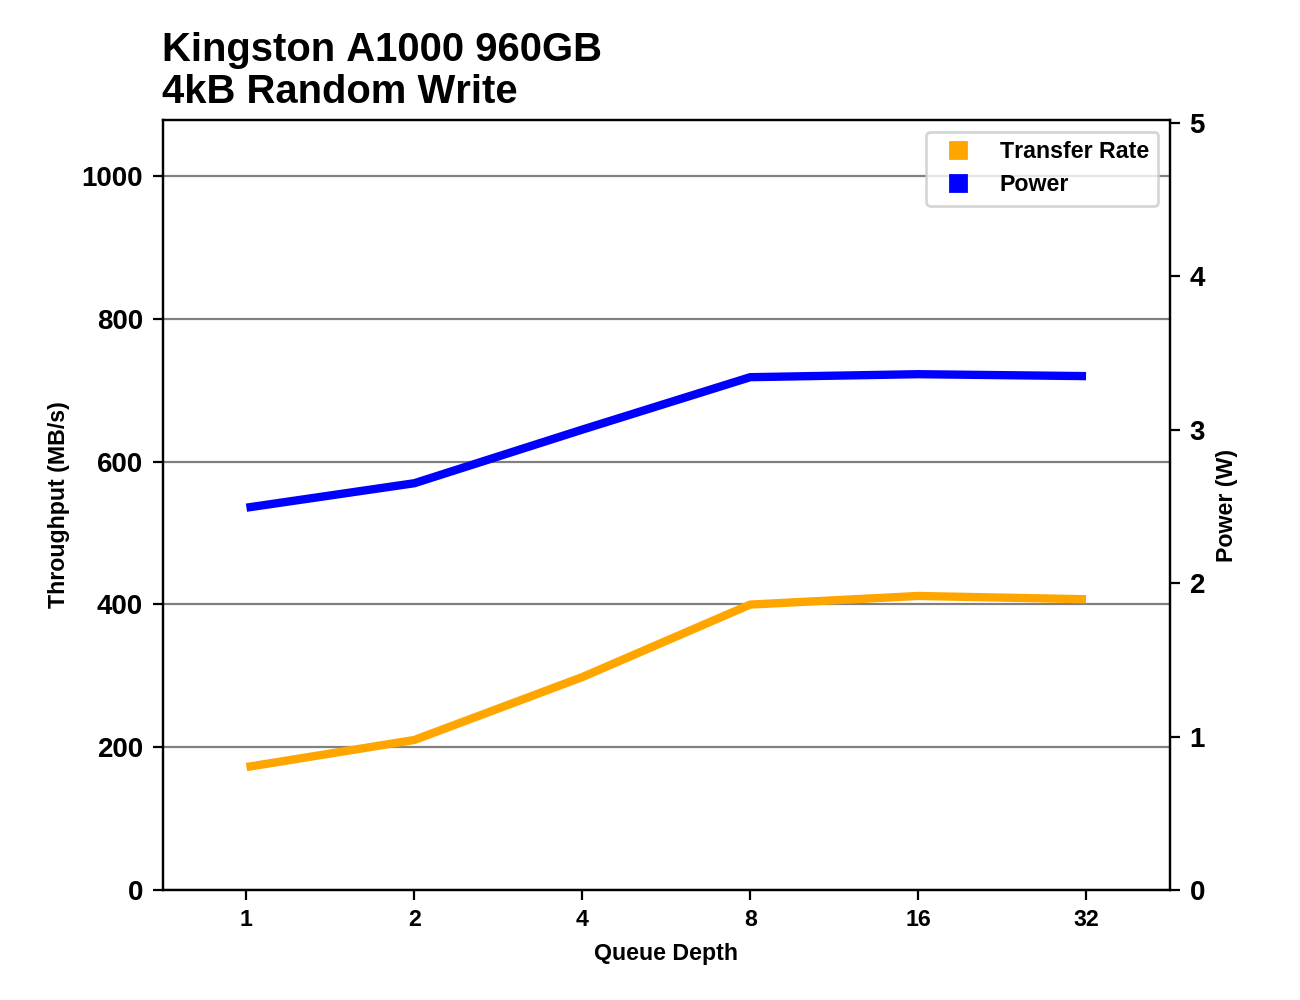
The Kingston A1000 shows similar queue depth scaling behavior to the MyDigitalSSD SBX, with performance topping out at QD8—rather late in the test compared to how most drives behave. Most other NVMe SSDs scale up to higher performance and get there with lower queue depths.
Originally published at https://www.anandtech.com/show/12991/the-kingston-a1000-nvme-ssd-review (Wayback Machine).