
Smartphone Audio Quality Testing
- Posted in
- Smartphones
- Audio
- Mobile
- Tablets
- Testing
Maximum Level
The maximum output level is derived from the 1kHz test tone used to determine THD+N. The higher the output from the headphone jack, the louder it can drive a pair of headphones. More importantly, having more power available means when you have dynamic music passages that call for power you are less likely to clip the waveform.
There is no chart to show here, just a number that the Audio Precision gives us. In our test data, the most powerful phone was the iPhone 5, at 32.46 mW of power. Next is the Nexus 5 at 22.24 mW, though we can’t drive it that high. Then the Note 3 at 11.81 mW and finally the Galaxy S4 at 3.895 mW. Doubling the power, from 4 mW to 8 mW, produces a 3 dB increase in volume level. 3 dB is the smallest change in volume levels we can easily hear. So even though the iPhone 5 produces 32 mW vs. 4 mW, that is only a 9 dB difference in volume. 10 dB is doubling the volume, so it isn’t even twice as loud. If you have demanding headphones, you will want as much power as you can get.
Frequency Response
To measure the frequency response we measure a set of 61 tones from 20 Hz to 20 kHz. All of these are then equalized to 1 kHz so we can see the maximum deviation from that level. An ideal phone will be perfectly flat here and allow you to adjust this with an EQ setting, or though your taste in headphones. On this test our best performing phone is the Galaxy S4, as seen here.
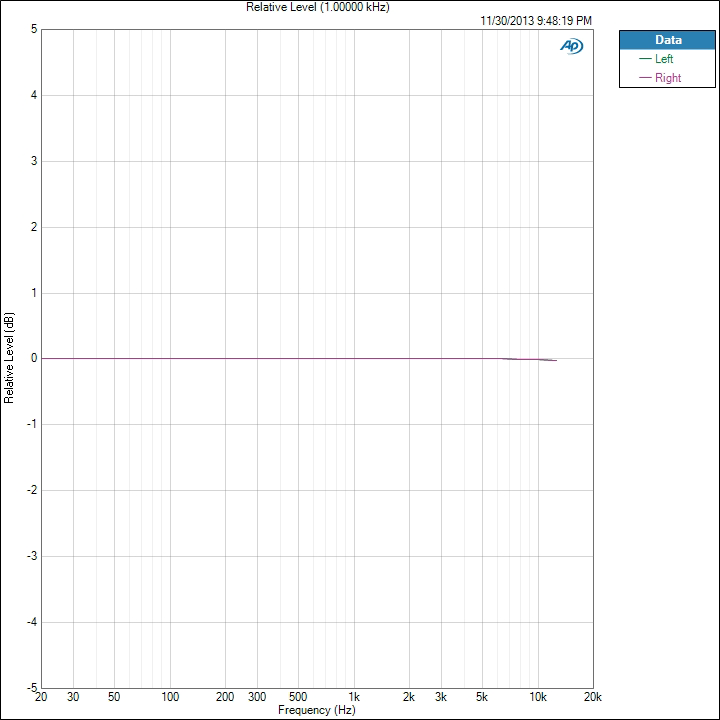
The total variation from 1 kHz is only 0.014 dB which is very good. The worst performing phone is the iPhone 5, but its variation is only 0.089 dB.
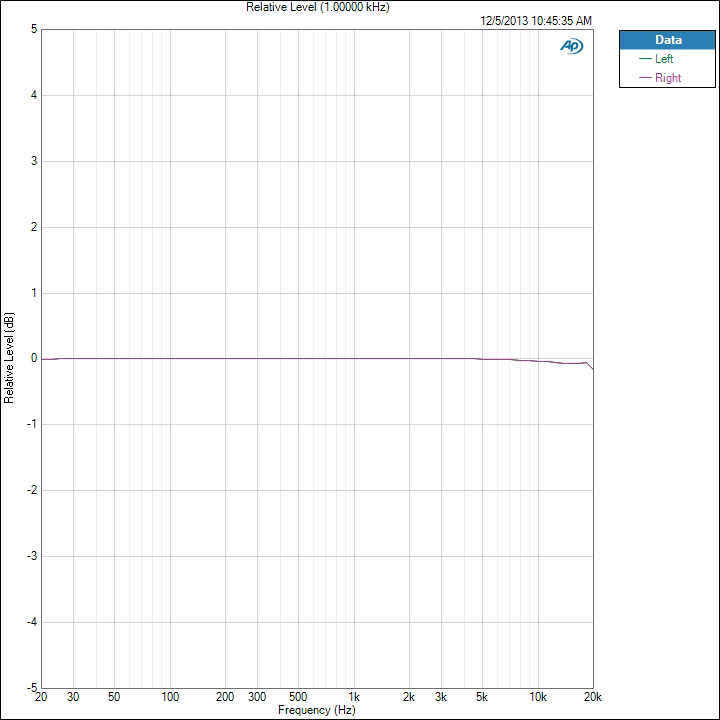
The iPhone 5 also picked up the 20 kHz tone while the Samsung and many others missed it. If we dropped this tone then it might be just as flat. The iPhone 5 test was run slightly differently, as it can't run the Android test program, which might account for this. For a phone with a different response, here is the HTC One with Beats enabled. Other HTC One testing is still in progress as I write this article.
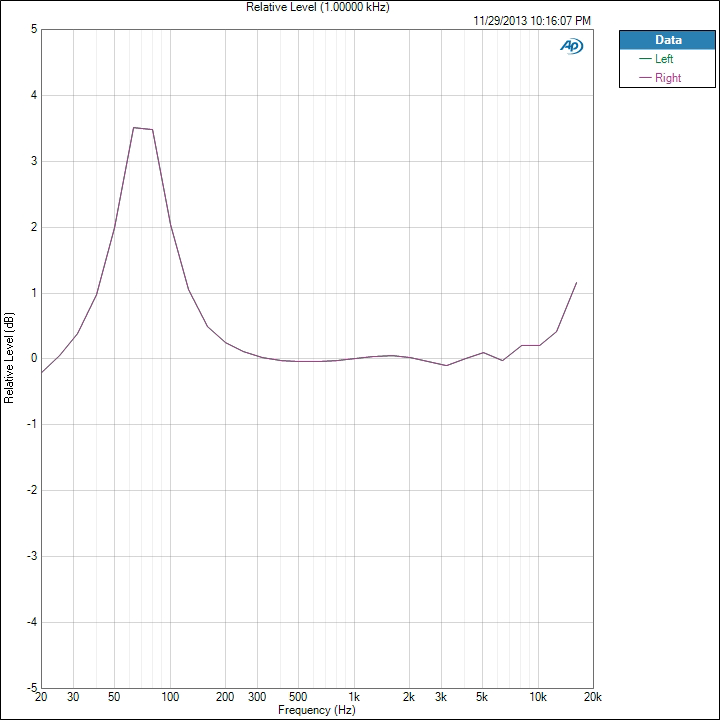
Here we see that Beats is adding a +3.5 dB boost from 60 Hz to 90 Hz, but the deviation from 0 dB goes from 30Hz to 300 Hz. Past 6.5 kHz we also see a rise in the treble. People often mistake boosted treble for extra detail, which is likely the reasoning behind this. As we see it is far different than the other two examples we looked at.
Originally published at https://www.anandtech.com/show/7567/smartphone-audio-quality-testing (Wayback Machine).