
G.Skill TridentX Review: 2x4GB at DDR3-2666 C11-13-13 1.65V
Synthetic testing has a way of elevating what may be a minor difference between hardware into a larger-than-life comparison, despite the effect on the usage of the system being near minimal. There are several benchmarks which straddle the line between synthetic and real world (such as Cinebench and SPECviewperf) which we include here, plus a couple which users at home can use to compare their memory settings.
SPECviewperf
The mix of real-world and synthetic benchmarks does not get more complex than SPECviewperf – a benchmarking tool designed to test various capabilities in several modern 3D renders. Each of these rendering programs come with their own coding practices, and as such can either be memory bound, CPU bound or GPU bound. In our testing, we use the standard benchmark and report the results for comparison.

SPECviewperf gracefully provides us with a mixed bag of results. For the majority of situations where the 2666C11 kit is on top (Lightwave, Maya, TCVis, snx), the kit is only just above the nearest challengers, meaning in each case the 2133 C9 kit still makes sense. From the point of view of the other renderers (especially catia), the 2133 C9 represents a happy medium over all the kits provided.
Cinebench x64
A long time favourite of synthetic benchmarkers the world over is the use of Cinebench, software designed to test the real-world application of rendering software via the CPU or GPU. In this circumstance we test the CPU single core and multi-core performance, as well as the GPU performance using a single GTX 580 at x16 PCIe 2.0 bandwidth. Any serial factors have to be processed through the CPU, and as such any memory access will either slow or speed up the benchmark.
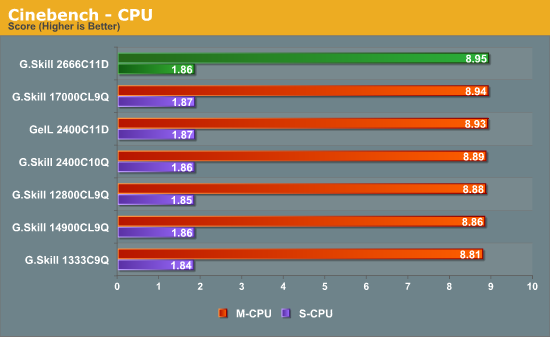
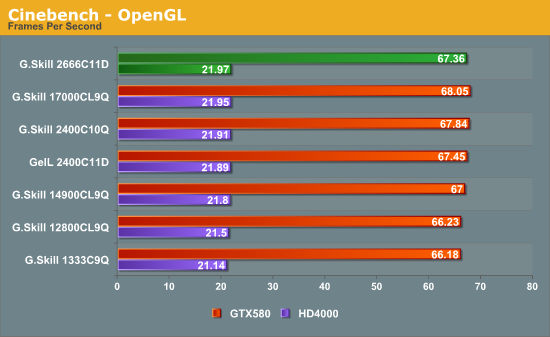
While nothing significant happens on the CPU side when using 2666 C11 memory, the IGP OpenGL portion of Cinebench gives our highest result, albeit with a less than 4% improvement over 1333 C9.
USB 3.0 + Thunderbolt Backup
Our backup testing takes a typical set of user files – specifically just under 8000 files across 7.5 GB, some large files but mostly small. For USB 3.0 testing, these files are copied from our SSD onto an OCZ Vertex3 which is connected via a SATA 6 Gbps to USB 3.0 device using the UASP protocol that the ASMedia controller on our test bed affords as well as the chipset driven Intel USB 3.0 under ASUS' Turbo mode. The copy test is conducted using DiskBench, a copying tool with accurate copy timing.
Similar to our USB 3.0 Backup test, Thunderbolt testing carries the same files directly through to our LittleBig Disk which contains two 120 GB Intel SSDs in RAID-0.

For all the USB 3.0 copy tests, we see that the movement from 1333 C9 to 1600 C9 gives a distinct gain, but above this not much gain is to be had – only small differences (e.g. USB 3.0 with Intel + Turbo). However, our Thunderbolt test causes a big spike with our G.Skill 2666 C11 kit. This is because of how our test is set up:
- Create 4 GB RAM Disk, populate with data (to eliminate read speed limitations of SSDs)
- Use DiskBench to copy from RAMDisk to Thunderbolt Device
The way Thunderbolt works is to copy the data from the source into the memory, then onto the device. Due to the 2666 C11 kit only being 8 GB total, there is not enough space for the RAMDisk and a copy of the RAMDisk’s contents to be stored in memory. This means the system has to copy as much as it can to begin with, wipe the copy from the memory, then transfer the rest into memory for moving onto the device. This adds latency.
This is technically how the USB 3.0 test works as well too, but the USB 3.0 test seems to clean up as it copies in order to hide copy-from-source-to-memory latency.
Originally published at https://www.anandtech.com/show/6389/gskill-tridentx-review-2x4gb-at-ddr32666-c111313-165v (Wayback Machine).