
ASUS F2A85-V Pro Review: A Look at FM2 with A85X
- Posted in
- Motherboards
- Asus
- Trinity
- FM2
- A85X
Many thanks to...
We must thank the following companies for kindly donating hardware for our test bed:
OCZ for donating the Power Supply and USB testing SSD
Micron for donating our SATA testing SSD
G.Skill for donating our memory kits
ASUS for donating AMD GPUs and some IO testing kit
ECS for donating NVIDIA GPUs
Gigabyte for donating the i3-3225 used for comparison
Comparison of AMD Processors
On the following benchmarks, we will use results from comparible tests with previous processor families over the past 18 months. For AMD, this means we can compare the new Piledriver modules to Llano with its Stars cores, Phenom II and Thuban, and Zambezi with Bulldozer. The following processors are ones we have a variety of results for:
A6-3650 (32nm, 2.6 GHz) – Llano, 4 Stars cores
A8-3850 (32nm, 2.9 GHz) – Llano, 4 Stars cores
X6 1100T (45nm, 3.7 GHz Turbo) – Phenom II, 6 Thuban cores
FX-8150 (32nm, 4.2 GHz Turbo) – Zambezi, 4 Bulldozer modules
A10-5800K (32nm, 4.2GHz) – Trinity, 2 Piledriver modules
On the Intel side, we have the following:
Core i7-3960X (32nm, 3.9 GHz Turbo) – Sandy Bridge-E, 6 cores / 12 threads
Core i7-3770K (22nm, 3.9 GHz Turbo) – Ivy Bridge, 4 cores / 8 threads
Core i5-2500K (32nm, 3.7 GHz Turbo) – Sandy bridge, 4 cores / 4 threads
Core i3-3225 (22nm, 3.3 GHz) – Ivy Bridge, 2 cores / 4 threads
The aim of AMD is to put the A10 square on the bow of the Core i3-3225. For comparison, the A10-5800K release price is $122, whereas the boxed version of the i3-3225 should be ~$144.
Test Setup
| Processor |
AMD Trinity A10-4800K APU 2 Modules, 4 Threads, 3.8 GHz (4.2 GHz Turbo) |
| Motherboards | ASUS F2A85-V Pro |
| Cooling | beQuiet DarkPro CPU Cooler |
| Power Supply |
OCZ 1250W Gold ZX Series Rosewill SilentNight 500W Platinum PSU |
| Memory | G.Skill TridentX 4x4 GB DDR3-2400 10-12-12 Kit |
| Memory Settings | XMP |
| Video Cards |
ASUS HD7970 3GB ECS GTX 580 1536MB |
| Video Drivers |
Catalyst 12.3 NVIDIA Drivers 296.10 WHQL |
| Hard Drive | Corsair Force GT 60 GB (CSSD-F60GBGT-BK) |
| Optical Drive | LG GH22NS50 |
| Case | Open Test Bed - DimasTech V2.5 Easy |
| Operating System | Windows 7 64-bit |
| SATA Testing | Micron RealSSD C300 256GB |
| USB 2/3 Testing | OCZ Vertex 3 240GB with SATA->USB Adaptor |
Our main Intel comparison system is a to-be-reviewed Gigabyte H77N-WiFi with a 65W dual core i3-3225 processor against the 100W A10-5800K.
Power Consumption
Power consumption was tested on the system as a whole with a wall meter connected to a Rosewill 500W 80PLUS Platinum SilentNight power supply. As I am in the UK on a 230-240 V supply this leads to ~75% efficiency at low loads, and 90%+ efficiency between 20% and 100% loading. This method of power reading allows us to compare the power management of the UEFI and the board to supply components with power under load, and includes typical PSU losses due to efficiency. These are the real world values that consumers may expect from a typical system (minus the monitor) using this motherboard.
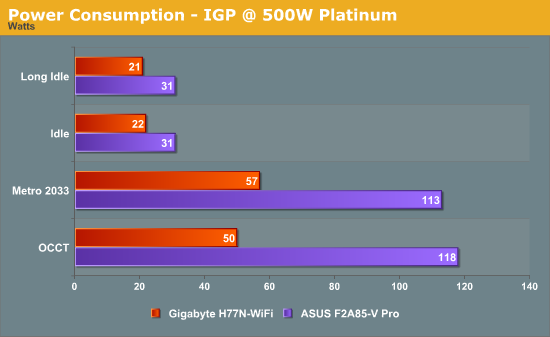
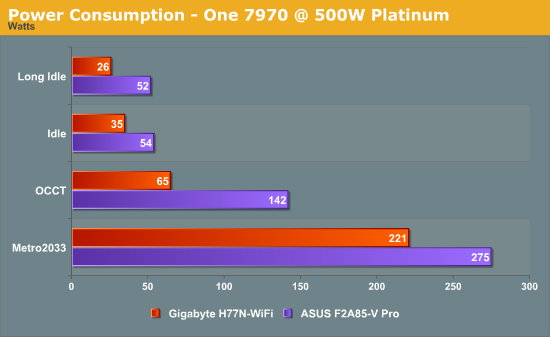
From our internal results, testing with 1 GPU on the 500W Platinum and 1250W Gold gave similar power readouts (Idle/OCCT/Metro on 500W gave 54/142/275, on 1250W gave 59/148/280), which means the 1250W is still good for comparison on the system. However for IGP testing, it was important to use the 500W. Our main comparison is the i3-3225 dual core Intel system on the to-be-reviewed Gigabyte H77N-WiFi, though the wattage between the processors accounts for large differences under load. At idle the larger ATX F2A85-V Pro does consume more power – if we get an ITX FM2 system, this will be a better comparison to test.
POST Time
Different motherboards have different POST sequences before an operating system is initialized. A lot of this is dependent on the board itself, and POST boot time is determined by the controllers on board (and the sequence of how those extras are organized). As part of our testing, we are now going to look at the POST Boot Time - this is the time from pressing the ON button on the computer to when Windows starts loading. (We discount Windows loading as it is highly variable given Windows specific features.) These results are subject to human error, so please allow +/- 1 second in these results.
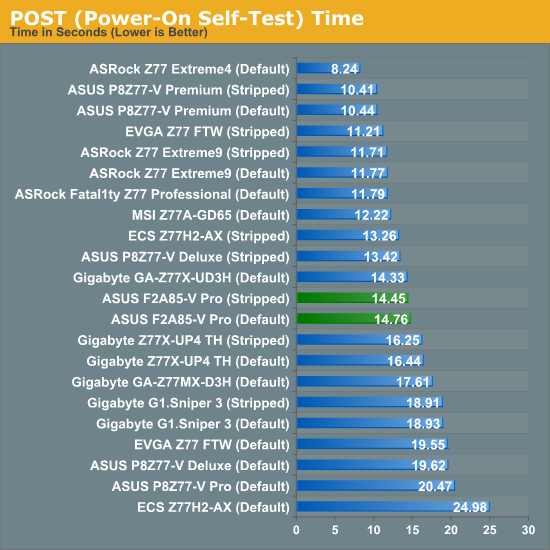
The F2A85-V Pro uses ASUS’ new CAP BIOS system, designed to aid in POST times across their motherboard range. It helps a little here, as normally for ATX boards POST times are in the 16+ second region – the CAP BIOS reduces this to just under 15 seconds.
Originally published at https://www.anandtech.com/show/6360/asus-f2a85v-pro-review-a-look-at-fm2-with-a85x (Wayback Machine).