
The GeForce GTX 660 Ti Review, Feat. EVGA, Zotac, and Gigabyte
Compute Performance
Shifting gears, as always our final set of real-world benchmarks is a look at compute performance. As we have seen with GTX 680 and GTX 670, GK104 appears to be significantly less balanced between rendering and compute performance than GF110 or GF114 were, and as a result compute performance suffers. Cache and register file pressure in particular seem to give GK104 grief, which means that GK104 can still do well in certain scenarios, but falls well short in others. For GTX 660 Ti in particular, this is going to be a battle between the importance of shader performance – something it has just as much of as the GTX 670 – and cache/memory pressure from losing that ROP cluster and cache.
Our first compute benchmark comes from Civilization V, which uses DirectCompute to decompress textures on the fly. Civ V includes a sub-benchmark that exclusively tests the speed of their texture decompression algorithm by repeatedly decompressing the textures required for one of the game’s leader scenes. Note that this is a DX11 DirectCompute benchmark.
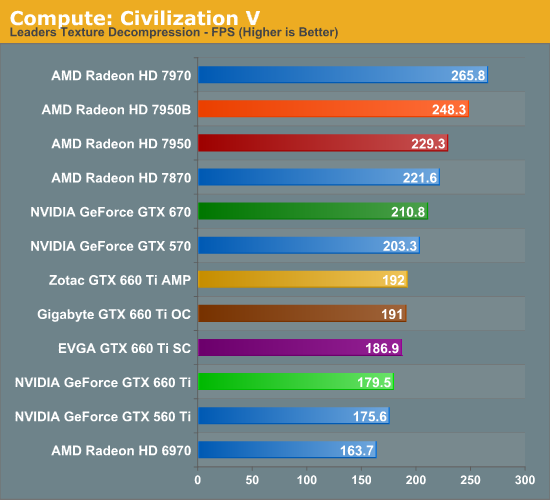
For Civilization V memory bandwidth and cache are clearly more important than raw compute performance in this test. Although this isn’t a worst case scenario outcome for the GTX 660 Ti, it drops substantially from the GTX 670. As a result its compute performance is barely better than the GTX 560 Ti, which wasn’t a strong performer at compute in the first place.
Our next benchmark is SmallLuxGPU, the GPU ray tracing branch of the open source LuxRender renderer. We’re now using a development build from the version 2.0 branch, and we’ve moved on to a more complex scene that hopefully will provide a greater challenge to our GPUs.
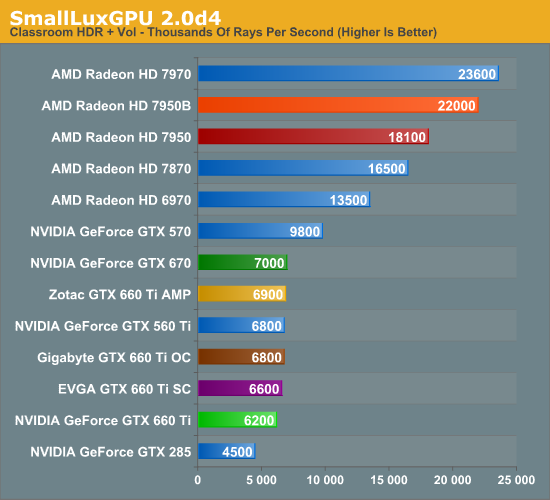
Ray tracing likes memory bandwidth and cache, which means another tough run for the GTX 660 Ti. In fact it’s now slower than the GTX 560 Ti. Compared to the 7950 this isn’t even a contest. GK104 is generally bad at compute, and GTX 660 Ti is turning out to be especially bad.
For our next benchmark we’re looking at AESEncryptDecrypt, an OpenCL AES encryption routine that AES encrypts/decrypts an 8K x 8K pixel square image file. The results of this benchmark are the average time to encrypt the image over a number of iterations of the AES cypher.
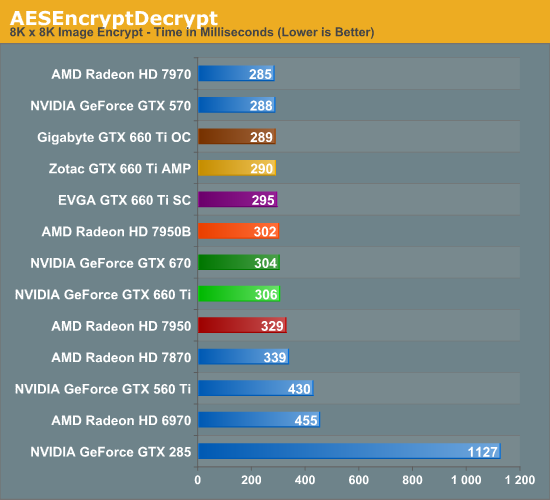
The GTX 660 Ti does finally turn things around on our AES benchmark, thanks to the fact that it generally favors NVIDIA. At the same time the gap between the GTX 670 and GTX 660 Ti is virtually non-existent.
Our fourth benchmark is once again looking at compute shader performance, this time through the Fluid simulation sample in the DirectX SDK. This program simulates the motion and interactions of a 16k particle fluid using a compute shader, with a choice of several different algorithms. In this case we’re using an (O)n^2 nearest neighbor method that is optimized by using shared memory to cache data.
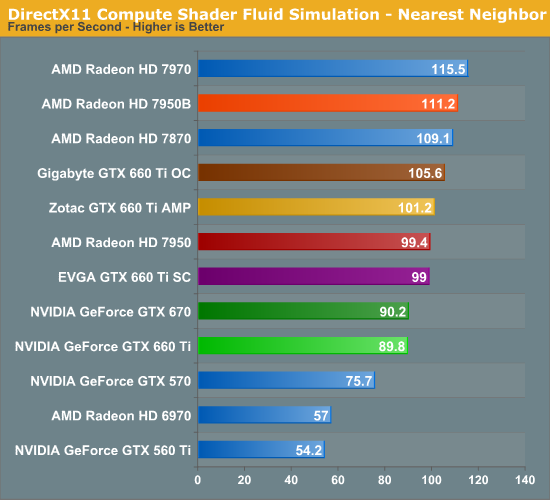
The compute shader fluid simulation provides the GTX 660 Ti another bit of reprieve, although like other GK104 cards it’s still relatively weak. Here it’s virtually tied with the GTX 670 so it’s clear that it isn’t being impacted by cache or memory bandwidth losses, but it needs about 10% more to catch the 7950.
Finally, we’re adding one last benchmark to our compute run. NVIDIA and the Folding@Home group have sent over a benchmarkable version of the client with preliminary optimizations for GK104. Folding@Home and similar initiatives are still one of the most popular consumer compute workloads, so it’s something NVIDIA wants their GPUs to do well at.
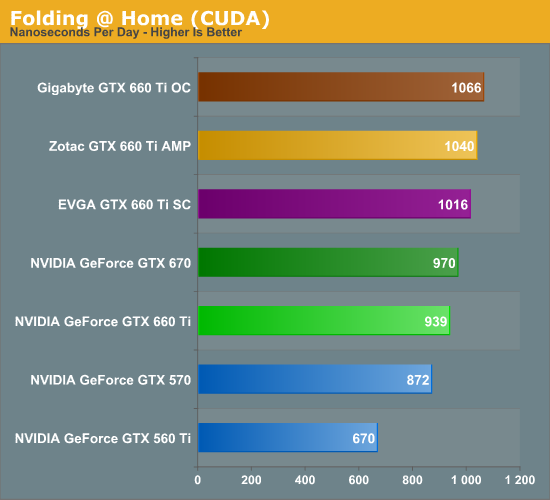
Interestingly Folding @ Home proves to be rather insensitive to the differences between the GTX 670 and GTX 660 Ti, which is not what we would have expected. The GTX 660 Ti isn’t doing all that much better than the GTX 570, once more reflecting that GK104 is generally struggling with compute performance, but it’s not a bad result.
Originally published at https://www.anandtech.com/show/6159/the-geforce-gtx-660-ti-review (Wayback Machine).