
The Intel SSD 330 Review (60GB, 120GB, 180GB)
The Test
| CPU | Intel Core i7 2600K running at 3.4GHz (Turbo & EIST Disabled) - for AT SB 2011, AS SSD & ATTO |
| Motherboard: | Intel DH67BL Motherboard |
| Chipset: | Intel H67 |
| Chipset Drivers: | Intel 9.1.1.1015 + Intel RST 10.2 |
| Memory: | Corsair Vengeance DDR3-1333 2 x 2GB (7-7-7-20) |
| Video Card: | eVGA GeForce GTX 285 |
| Video Drivers: | NVIDIA ForceWare 190.38 64-bit |
| Desktop Resolution: | 1920 x 1200 |
| OS: | Windows 7 x64 |
Random Read/Write Speed
The four corners of SSD performance are as follows: random read, random write, sequential read and sequential write speed. Random accesses are generally small in size, while sequential accesses tend to be larger and thus we have the four Iometer tests we use in all of our reviews.
Our first test writes 4KB in a completely random pattern over an 8GB space of the drive to simulate the sort of random access that you'd see on an OS drive (even this is more stressful than a normal desktop user would see). I perform three concurrent IOs and run the test for 3 minutes. The results reported are in average MB/s over the entire time. We use both standard pseudo randomly generated data for each write as well as fully random data to show you both the maximum and minimum performance offered by SandForce based drives in these tests. The average performance of SF drives will likely be somewhere in between the two values for each drive you see in the graphs. For an understanding of why this matters, read our original SandForce article.
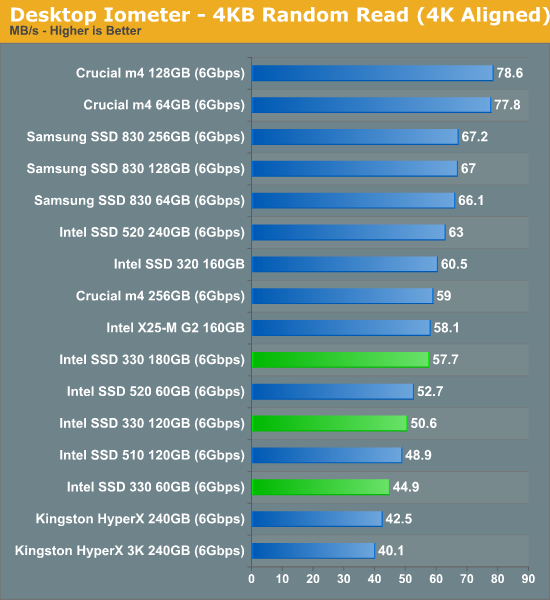
At similar capacities, the 330 and 520 offer nearly identical random read performance. The old X25-M G2 actually offers better random read performance than many of the newer drives, although most users would be hard pressed to tell the difference in actual usage.
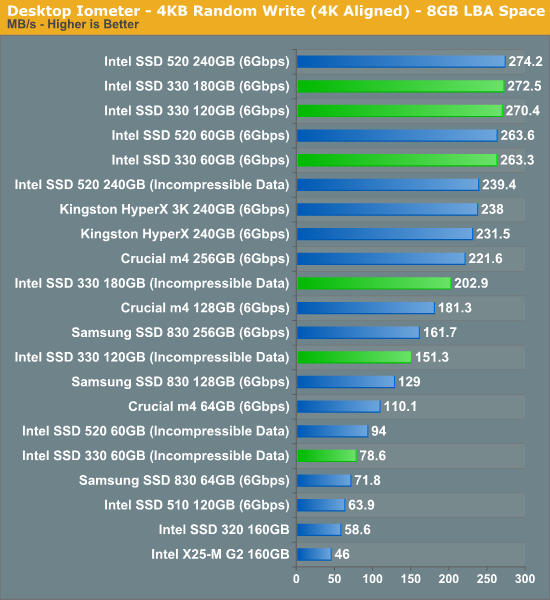
Random write performance is great with easily compressible data, but even when faced with data that can't be reduced the Intel SSD 330 does very well. Once again performance is very similar between the 330 and 520 drives.
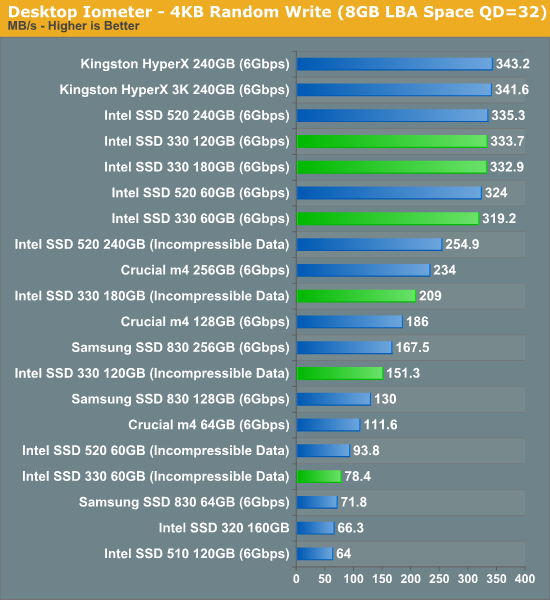
Many of you have asked for random write performance at higher queue depths. What I have below is our 4KB random write test performed at a queue depth of 32 instead of 3. While the vast majority of desktop usage models experience queue depths of 0 - 5, higher depths are possible in heavy I/O (and multi-user) workloads:
Sequential Read/Write Speed
To measure sequential performance I ran a 1 minute long 128KB sequential test over the entire span of the drive at a queue depth of 1. The results reported are in average MB/s over the entire test length.
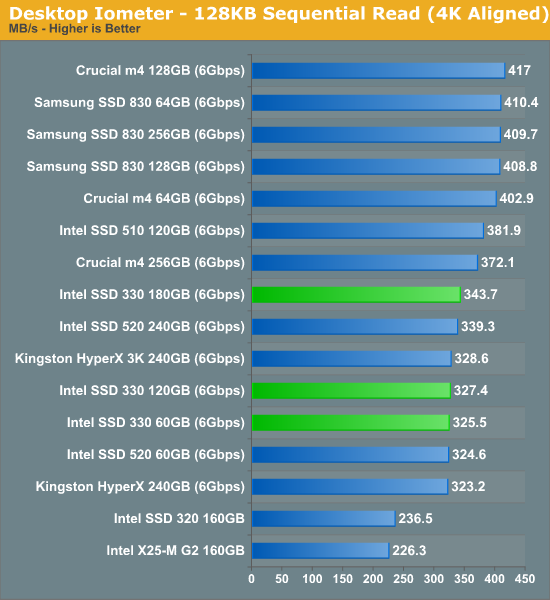
Low queue depth sequential read performance is good but not exactly class leading. Once again there's no real performance difference between the 330 and 520.
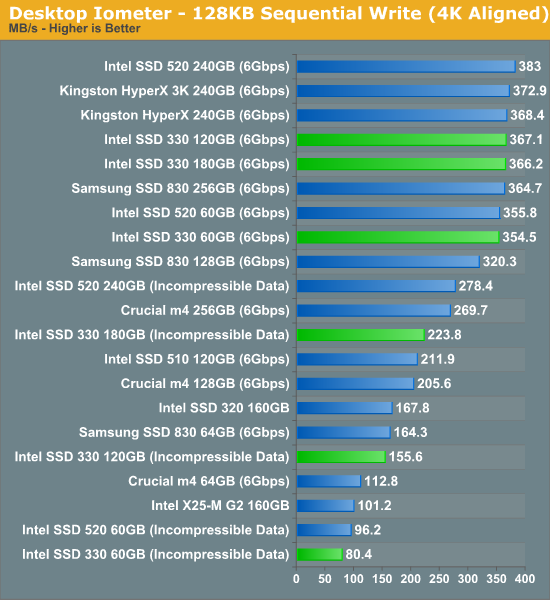
Sequential write performance with incompressible data is the biggest downside to any SandForce based drive. Try copying a compressed video or photos to the drive and you'll get speeds south of 230MB/s. The 60GB drive can only manage 80MB/s with incompressible data, that's actually no faster than the old Intel X25-M.
AS-SSD Incompressible Sequential Performance
The AS-SSD sequential benchmark uses incompressible data for all of its transfers. The result is a pretty big reduction in sequential write speed on SandForce based controllers.
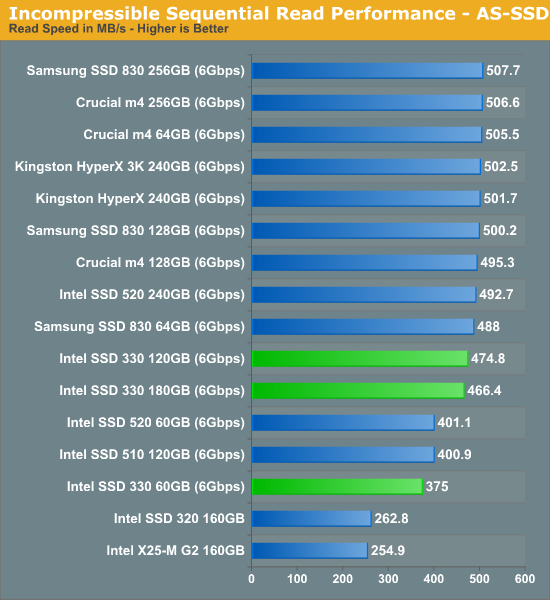
Here we see what higher queue depth sequential reads look like. The 330 gets close to 500MB/s but never actually exceeds it.
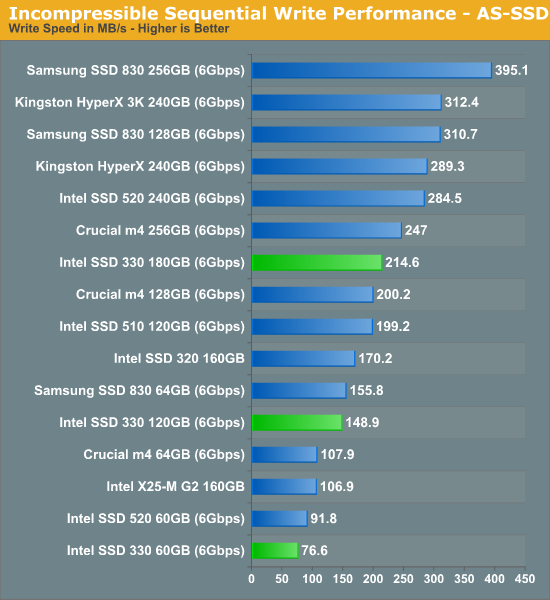
Incompressible sequential write performance, again, doesn't look very good.
Originally published at https://www.anandtech.com/show/5817/the-intel-ssd-330-review-60gb-120gb-180gb (Wayback Machine).