
abit IP35-Pro: Houston, We Have a Winner
- Posted in
- Motherboards
Synthetic Graphics Performance
The 3DMark series of benchmarks developed and provided by Futuremark are among the most widely used tools for benchmark reporting and comparisons. Although the benchmarks are very useful for providing apple to apple comparisons across a broad array of GPU and CPU configurations they are not a substitute for actual application and gaming benchmarks. In this sense, we consider the 3DMark benchmarks to be purely synthetic in nature but still valuable for providing consistent measurements of performance.
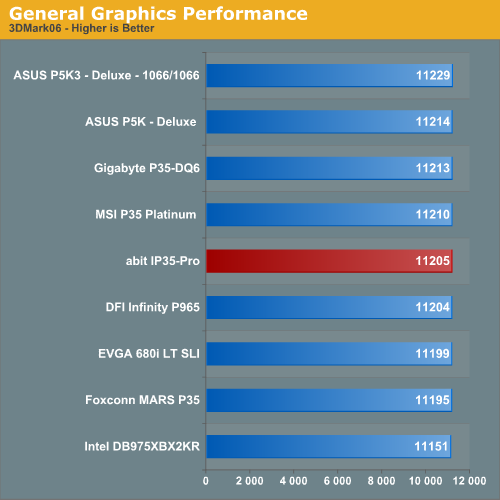
In our 3DMark06 test, all of the boards are within 1% of each other. When looking at the individual tests, the Foxconn board scores well in the CPU and SM3.0 sections but is third from the last in the SM2.0 tests.
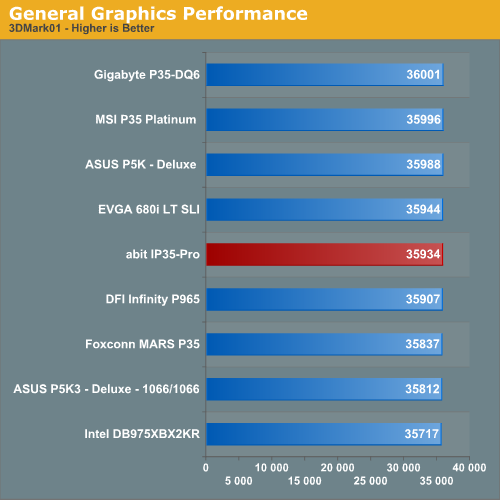
In the more memory and CPU throughput sensitive 3DMark01 benchmark, we see the spread between boards is way under 1%. The abit board once again scores in the middle of the pack but is only 67 points from the lead.
General System Performance
Futuremark's PCMark05 benchmark measures overall system performance for the typical home computing user. This tool provides both system and component level benchmarking results utilizing subsets of real world applications or programs. This benchmark is still useful for providing comparative results, but we will use PCMark Vantage in our next article.
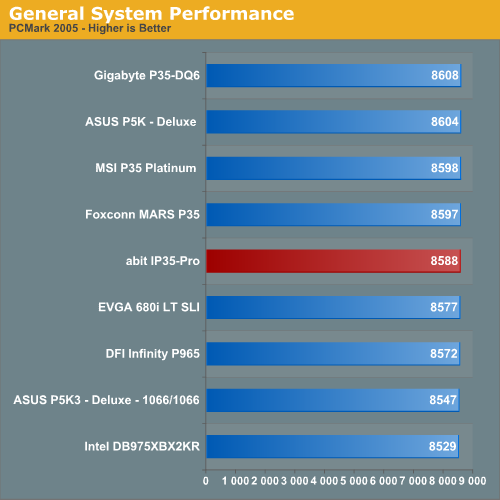
Once again, all of the boards are within shouting range of each other with the abit board finishing in the middle of the test group. The abit board scores very well in the Graphics and CPU sections while falling towards the middle of the pack in the storage system test.
The 3DMark series of benchmarks developed and provided by Futuremark are among the most widely used tools for benchmark reporting and comparisons. Although the benchmarks are very useful for providing apple to apple comparisons across a broad array of GPU and CPU configurations they are not a substitute for actual application and gaming benchmarks. In this sense, we consider the 3DMark benchmarks to be purely synthetic in nature but still valuable for providing consistent measurements of performance.
In our 3DMark06 test, all of the boards are within 1% of each other. When looking at the individual tests, the Foxconn board scores well in the CPU and SM3.0 sections but is third from the last in the SM2.0 tests.
In the more memory and CPU throughput sensitive 3DMark01 benchmark, we see the spread between boards is way under 1%. The abit board once again scores in the middle of the pack but is only 67 points from the lead.
General System Performance
Futuremark's PCMark05 benchmark measures overall system performance for the typical home computing user. This tool provides both system and component level benchmarking results utilizing subsets of real world applications or programs. This benchmark is still useful for providing comparative results, but we will use PCMark Vantage in our next article.
Once again, all of the boards are within shouting range of each other with the abit board finishing in the middle of the test group. The abit board scores very well in the Graphics and CPU sections while falling towards the middle of the pack in the storage system test.
Originally published at https://www.anandtech.com/show/2367 (Wayback Machine).