
Gigabyte GA-X38-DQ6: An early look at X38
- Posted in
- Motherboards
Synthetic Graphics Performance
The 3DMark series of benchmarks developed and provided by Futuremark are among the most widely used tools for benchmark reporting and comparisons. Although the benchmarks are very useful for providing apple to apple comparisons across a broad array of GPU and CPU configurations they are not a substitute for actual application and gaming benchmarks. In this sense we consider the 3DMark benchmarks to be purely synthetic in nature but still valuable for providing consistent measurements of performance.
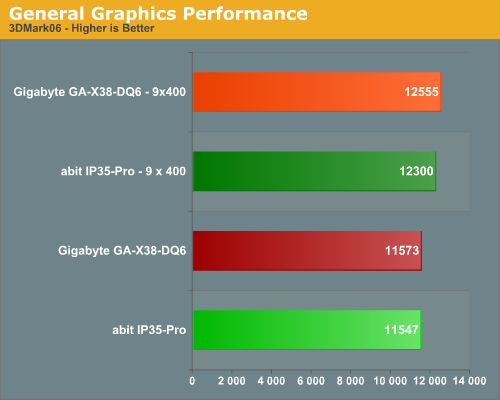
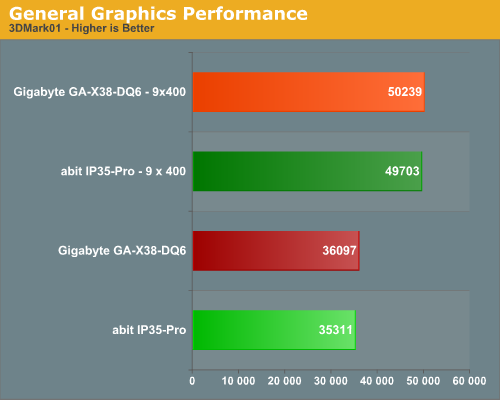
In our 3DMark06 test, the X38 and P35 are basically even in this test. The Gigabyte board is around 2% faster when overclocked although this margin is still relatively small. When looking at the individual tests, the Gigabyte board scored slightly better in the SM2.0 and SM3.0 tests while the CPU scores were just about identical when comparing the two chipsets.
In the more memory and CPU throughput sensitive 3DMark01 benchmark we see our Gigabyte GA-X38-DQ6 board about 2% quicker at stock speeds and only 1% when overclocked. The differences in performance are not really noticeable in either 3DMark unless you're looking to reach the top of the ORB, which we have a good feeling the X38 was designed to do with the right setup.
General System Performance
The PCMark05 benchmark developed and provided by Futuremark is designed to measure overall system performance for the typical home computing user. This tool provides both system and component level benchmarking results utilizing subsets of real world applications or programs. This benchmark is useful for providing comparative results across a broad array of Graphics, CPU, Hard Disk, and Memory configurations along with multithreading results. In this sense we consider the PCMark benchmark to be both synthetic and real world in nature and it again provides consistency in our benchmark results.
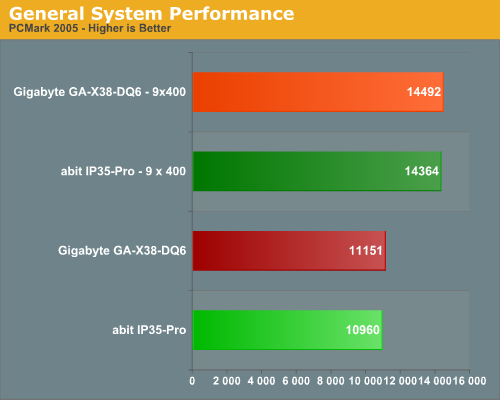
Our PCMark05 scores mimic the results from our 3DMark benchmarks with differences of around 2% at stock speeds and 1% when overclocked. While this benchmark is designed around actual application usage, we will see if these results mirror our own real-world application testing.
The 3DMark series of benchmarks developed and provided by Futuremark are among the most widely used tools for benchmark reporting and comparisons. Although the benchmarks are very useful for providing apple to apple comparisons across a broad array of GPU and CPU configurations they are not a substitute for actual application and gaming benchmarks. In this sense we consider the 3DMark benchmarks to be purely synthetic in nature but still valuable for providing consistent measurements of performance.
In our 3DMark06 test, the X38 and P35 are basically even in this test. The Gigabyte board is around 2% faster when overclocked although this margin is still relatively small. When looking at the individual tests, the Gigabyte board scored slightly better in the SM2.0 and SM3.0 tests while the CPU scores were just about identical when comparing the two chipsets.
In the more memory and CPU throughput sensitive 3DMark01 benchmark we see our Gigabyte GA-X38-DQ6 board about 2% quicker at stock speeds and only 1% when overclocked. The differences in performance are not really noticeable in either 3DMark unless you're looking to reach the top of the ORB, which we have a good feeling the X38 was designed to do with the right setup.
General System Performance
The PCMark05 benchmark developed and provided by Futuremark is designed to measure overall system performance for the typical home computing user. This tool provides both system and component level benchmarking results utilizing subsets of real world applications or programs. This benchmark is useful for providing comparative results across a broad array of Graphics, CPU, Hard Disk, and Memory configurations along with multithreading results. In this sense we consider the PCMark benchmark to be both synthetic and real world in nature and it again provides consistency in our benchmark results.
Our PCMark05 scores mimic the results from our 3DMark benchmarks with differences of around 2% at stock speeds and 1% when overclocked. While this benchmark is designed around actual application usage, we will see if these results mirror our own real-world application testing.
Originally published at https://www.anandtech.com/show/2314 (Wayback Machine).