
The Single 12V Rail SilverStone Olympia OP650
- Posted in
- Cases/Cooling/PSUs
Testing
We have already described our test setup and methodology here. Due to increasing heat the lower voltage rails will most likely decrease in output. This results from the tremendous ambient temperature in which we are testing power supplies and does not necessarily reflect what you will have in your PC at home. This is essentially a worst case test with respect to heat, and if the PSU performs well in our environment, you can be assured it will perform well in your PC. We are testing with 115VAC and 230VAC to cover all markets. To make the voltage drop more visible we will include graphs instead of tables. Above and below the dashed lines are out of spec values. Everything within these lines is within the specs and therefore acceptable.
To properly load the power supply we are using a Chroma DC Load. In this way we are able to put a specific amount of load on each of the connected rails. We are testing in ten steps beginning with 10% load and ending with 100% of each power supply's maximum output. The total procedure is taking us 5 hours for each of the two input voltages.
115VAC 3.3V, 5V, and 5Vsb Tests
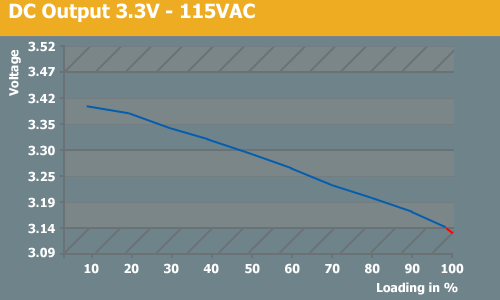
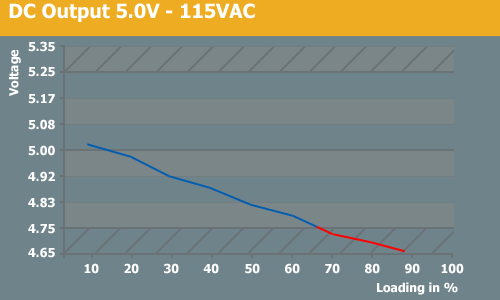
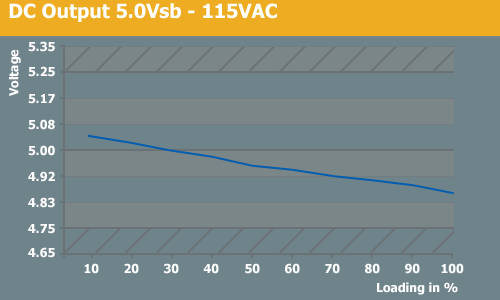
The lower voltage rails have dropped hard during the test and they went under specification at about 80-90% of load. The 5v rail dropped under spec at around 65% load. With 230VAC things looked a little better. This could have been partly because we tested 230V first and the power supply might have been sweating it.
We have already described our test setup and methodology here. Due to increasing heat the lower voltage rails will most likely decrease in output. This results from the tremendous ambient temperature in which we are testing power supplies and does not necessarily reflect what you will have in your PC at home. This is essentially a worst case test with respect to heat, and if the PSU performs well in our environment, you can be assured it will perform well in your PC. We are testing with 115VAC and 230VAC to cover all markets. To make the voltage drop more visible we will include graphs instead of tables. Above and below the dashed lines are out of spec values. Everything within these lines is within the specs and therefore acceptable.
To properly load the power supply we are using a Chroma DC Load. In this way we are able to put a specific amount of load on each of the connected rails. We are testing in ten steps beginning with 10% load and ending with 100% of each power supply's maximum output. The total procedure is taking us 5 hours for each of the two input voltages.
115VAC 3.3V, 5V, and 5Vsb Tests
The lower voltage rails have dropped hard during the test and they went under specification at about 80-90% of load. The 5v rail dropped under spec at around 65% load. With 230VAC things looked a little better. This could have been partly because we tested 230V first and the power supply might have been sweating it.
Originally published at https://www.anandtech.com/show/2275 (Wayback Machine).