
Gateway E-155-C: A Lightweight Convertible
- Posted in
- Laptops
General Performance
To measure general performance, we're now using SYSmark 2007 as well as PCMark05. We don't have SYSmark 2007 results for most of the other laptops, and with the disparity in components used it's not too surprising that the E-155-C ranks at the bottom of nearly all of our tests. Here then is a quick summary of the results:
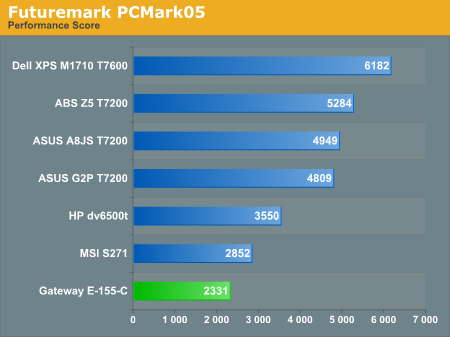
The PCMark05 result is also at the bottom of the pack, but the overall score obfuscates things somewhat. Without breaking things down a bit more, you don't actually know just by looking at the score whether the result stems from your graphics, your hard drive, your processor, or something else. To help provide a more comprehensive look at performance, we will also provide a table of the individual results.
What do you get when you combine a low-power CPU, graphics, chipset, and memory with a relatively decent hard drive? You get the above table. With a clock speed that's roughly half of most of the other laptops, there's no reason to expect the performance offered to be anywhere near competitive. However, the Hitachi 5400 RPM hard drive does manage to outperform the drives used in several of the other laptops. Outside of the hard drive tests, however, even a Turion X2 TL-60 (2.0 GHz) is generally 50% or more faster than the Core 2 Duo U7500 (of course at the cost of increased power requirements).
To complement the SYSmark and PCMark results, we have some of our own benchmarks that test similar areas. Here's a quick look at how the laptops compare in audio/video encoding and 3D rendering
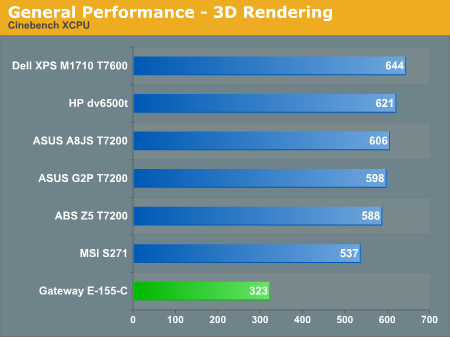
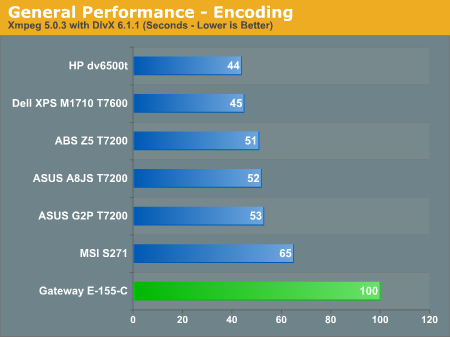
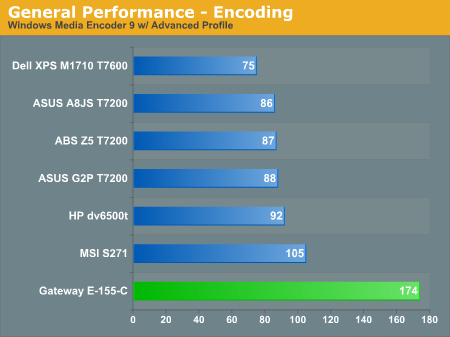
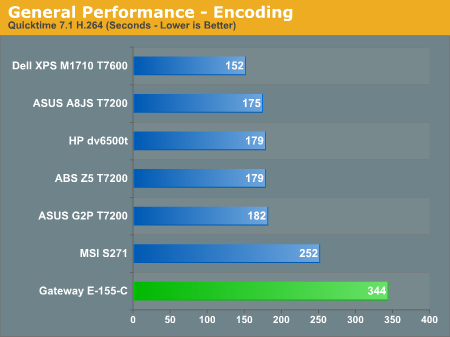
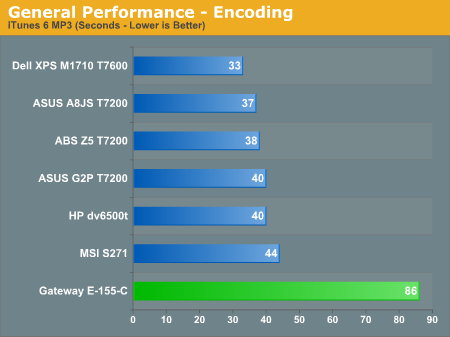
Again, there's not much to see in the above charts that's unexpected. Core 2 Duo processors perform very well, but at extremely low voltages and the accompanying low clock speeds they really aren't intended for any high-performance computing tasks.
To measure general performance, we're now using SYSmark 2007 as well as PCMark05. We don't have SYSmark 2007 results for most of the other laptops, and with the disparity in components used it's not too surprising that the E-155-C ranks at the bottom of nearly all of our tests. Here then is a quick summary of the results:
| SYSmark 2007 Performance | ||
| HP dv6500t | Gateway E-155-C | |
| Overall Score | 100 | 51 |
| E-Learning | 112 | 46 |
| Video Creation | 75 | 57 |
| Productivity | 102 | 45 |
| 3D | 112 | 56 |
The PCMark05 result is also at the bottom of the pack, but the overall score obfuscates things somewhat. Without breaking things down a bit more, you don't actually know just by looking at the score whether the result stems from your graphics, your hard drive, your processor, or something else. To help provide a more comprehensive look at performance, we will also provide a table of the individual results.
| PCMark05 Performance Breakdown | ||||||
| ABS Mayhem Z5 | ASUS A8JS | ASUS G2P | Dell M1710 | Gateway E-155-C | HP dv6500t | |
| HDD XP Startup (MB/s) | 5.839 | 6.623 | 6.183 | 7.602 | 7.326 | 4.717 |
| Physics and 3D (FPS) | 186.04 | 182.38 | 194 | 213.42 | 47.68 | 86.65 |
| 2D Transparency (Windows/s) | 1078.48 | 733.55 | 515.72 | 1263.64 | 380.74 | 685.63 |
| 3D Pixel Shaders (FPS) | 327.74 | 132.09 | 93.84 | 360.76 | 8.29 | 23.32 |
| Web Page Rendering (Pages/s) | 3.267 | 3.27 | 3.18 | 3.467 | 1.019 | 1.625 |
| File Decryption (MB/s) | 54.602 | 54.524 | 54.294 | 64.148 | 29.156 | 57.674 |
| 2D 64 Line Redraw (FPS) | 2111.47 | 1129.12 | 1326.54 | 2133.45 | 215.07 | 504.45 |
| HDD General Usage (MB/s) | 4.019 | 4.332 | 4.127 | 4.453 | 4.527 | 3.548 |
| Audio Compression (KB/s) | 2133.98 | 2219.17 | 2142.88 | 2351.51 | 1101.5 | 1935.72 |
| Video Encoding (KB/s) | 372.19 | 363.48 | 373.53 | 426.06 | 185.11 | 364.18 |
| Text Editing (Pages/s) | 137.3 | 139.57 | 138.75 | 159.67 | 57.36 | 99.63 |
| Image Decompression (MPixels/s) | 28.143 | 28.277 | 27.981 | 32.392 | 14.481 | 27.208 |
| File Compression (MB/s) | 4.831 | 4.819 | 4.577 | 5.597 | 2.577 | 4.411 |
| File Encryption (MB/s) | 26.513 | 26.512 | 27.54 | 31.225 | 13.173 | 27.799 |
| HDD Virus Scan (MB/s) | 32.924 | 35.32 | 43.118 | 37.266 | 36.45 | 26.171 |
| Memory Latency (MAccesses/s) | 8.011 | 8.207 | 8.207 | 8.011 | 6.63 | 8.797 |
What do you get when you combine a low-power CPU, graphics, chipset, and memory with a relatively decent hard drive? You get the above table. With a clock speed that's roughly half of most of the other laptops, there's no reason to expect the performance offered to be anywhere near competitive. However, the Hitachi 5400 RPM hard drive does manage to outperform the drives used in several of the other laptops. Outside of the hard drive tests, however, even a Turion X2 TL-60 (2.0 GHz) is generally 50% or more faster than the Core 2 Duo U7500 (of course at the cost of increased power requirements).
To complement the SYSmark and PCMark results, we have some of our own benchmarks that test similar areas. Here's a quick look at how the laptops compare in audio/video encoding and 3D rendering
Again, there's not much to see in the above charts that's unexpected. Core 2 Duo processors perform very well, but at extremely low voltages and the accompanying low clock speeds they really aren't intended for any high-performance computing tasks.
Originally published at https://www.anandtech.com/show/2266 (Wayback Machine).