
Intel P35: Intel's Mainstream Chipset Grows Up
- Posted in
- CPUs
Synthetic Graphics Performance
The 3DMark series of benchmarks developed and provided by Futuremark are among the most widely used tools for benchmark reporting and comparisons. Although the benchmarks are very useful for providing apples-to-apples comparisons across a broad array of GPU and CPU configurations they are not a substitute for actual application and gaming benchmarks. In this sense we consider the 3DMark benchmarks to be purely synthetic in nature but still very valuable for providing consistent measurements of performance.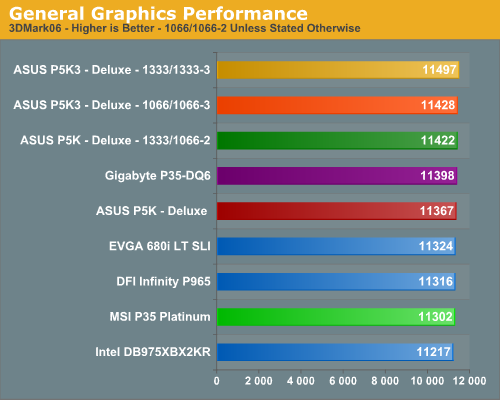
In our 3DMark06 test, all of the boards are grouped together with a 2.5% spread from top to bottom. The 975X board takes last place by a small margin, and we noticed in this benchmark that the R600 and 975X do not play well together as the 975X scores within 64 points of the P5K when using a NVIDIA 8800GTX. The latest beta R600 drivers have cured this problem and we will update our scores with the new 8.38 driver set for the roundup. The additional bandwidth available when using the P5K board at 1333/1066 settings resulted in the best CPU and SM2.0 scores in this benchmark.
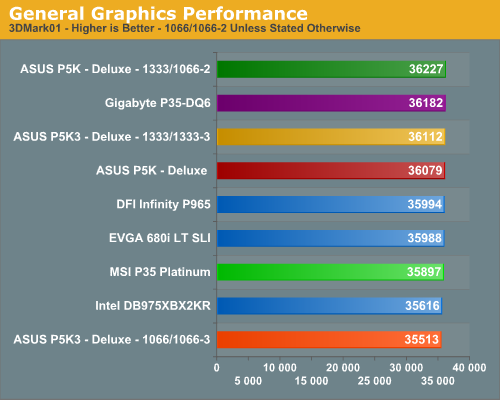
In the more memory and CPU sensitive 3DMark01 benchmark we see our ASUS P5K Deluxe board taking top honors but only with the FSB set to 1333 (8x333). The Gigabyte P35-DQ6 has the best stock scores at 1066/1066. Our 975x board is slightly handicapped at the 1066/800 settings although this chipset continues to offer excellent memory performance. The higher latencies on the P5K3 board hurt its stock performance although increasing bandwidth to 1333/1333 makes up for it. The spread from top to bottom is again only 2%, however, so minor differences in performance are not really noticeable in either 3DMark.
General System Performance
The PCMark05 benchmark developed and provided by Futuremark was designed for determining overall system performance for the typical home computing user. This tool provides both system and component level benchmarking results utilizing subsets of real world applications or programs. This benchmark is useful for providing comparative results across a broad array of Graphics, CPU, Hard Disk, and Memory configurations along with multithreading results. In this sense we consider the PCMark benchmark to be both synthetic and real world in nature, and it again provides for consistency in our benchmark results.
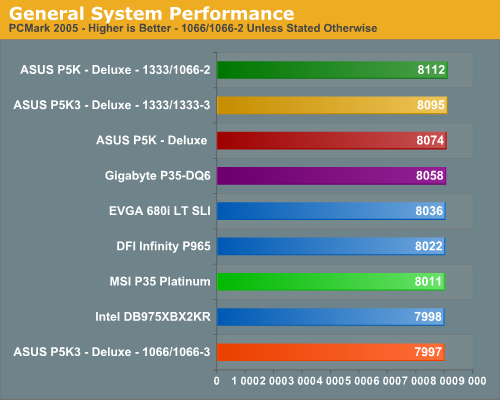
The ASUS boards have historically done well in this benchmark due to very strong multitasking performance and the same holds true once again. The stock P5K3 scores continue to show an issue with high latencies as this board scored at the bottom in the general application test. The increase to the 1333FSB provides slightly better results with the main increases coming in the multitasking tests. The spread in overall scores is only 1.5%, although in individual areas the differences between the boards may be more or less pronounced.
Rendering Performance
We are using the Cinebench 9.5 benchmark as it tends to heavily stress the CPU subsystem while performing graphics modeling and rendering. Cinebench 9.5 features two different benchmarks with one test utilizing a single core and the second test showcasing the power of multiple cores in rendering the benchmark image. We utilize the standard multiple core benchmark demo and default settings.
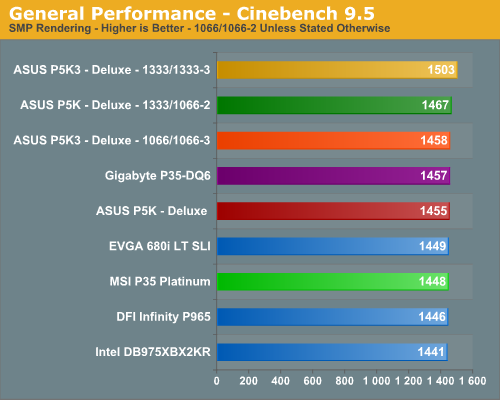
The improved bandwidth and front side bus speeds of the P5K3 board results in the top score, putting it 2.5% ahead of the closest competitor for the time being. The remaining boards are all clustered within 2% of each other, with most of the P35 boards placing ahead of the incumbents.
Originally published at https://www.anandtech.com/show/2236 (Wayback Machine).