
Tuniq Tower 120: Air Cooling to the Max
- Posted in
- Cases/Cooling/PSUs
CPU Cooling Test Configuration
A primary requirement for any cooling test bed is a reliable utility for measuring CPU temperature and fan speed. The utility also must be usable while other programs are running so the impact of stress testing can be assessed. It is not really critically important that the temperature measurements be completely accurate, but results must be consistent and repeatable using the same test setup.After assessing a number of Intel 975/965 and NVIDIA 680i motherboards the decision was reached to use the NVIDIA 680i as the cooling test bed. This was primarily based on the excellent temperature measurement utility, NVIDIA Monitor, which is part of the nTune program.
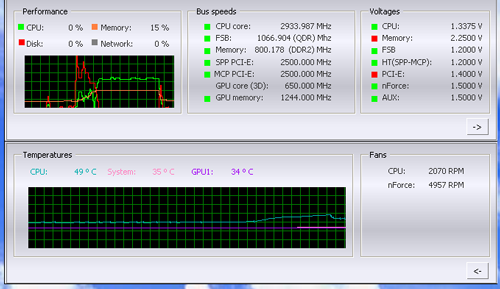
NVIDIA Monitor has a drop-down pane for temperature measurement which reports CPU, System, and GPU measurement. At this point we will concentrate primarily on CPU temperature with listings of system temps for reference. In addition to the real-time temperature measurement, NVIDIA Monitor also has a logging feature which can record temperature in a file in standard increments (we selected every 4 seconds). This allows recording of temperatures during testing and play back, for example, of stress test results that can then be examined when the stress tests are completed. There is also the handy reference of speeds and voltages in the top pane to confirm the test setup. These factors made NVIDIA Monitor on the 680i the ideal program for evaluating cooling.
Further tests using the program showed results were consistent over the same setup and repeatable under similar conditions. For all of these reasons NVIDIA Monitor on the NVIDIA 680i was used for testing cooling. Other components in the cooling test bed are generally the same as those used in our motherboard and memory test bed:
| Cooling Performance Test Configuration | |
| Processor: | Intel Core 2 Duo X6800 (x2 2.93GHz, 4MB Unified Cache) |
| RAM: | 2x1GB Corsair Dominator PC2-8888 (DDR2-1111) |
| Hard Drive: | Hitachi 250GB SATA2 enabled (16MB Buffer) |
| Video Card: | 1 x EVGA 7900GTX - All Standard Tests |
| Platform Drivers: | NVIDIA 9.53 |
| Video Drivers: | NVIDIA 93.71 |
| CPU Cooling: | Tuniq Tower 120 Intel Stock HSF for X6800 |
| Power Supply: | OCZ PowerStream 520W |
| Motherboard: | EVGA 680i SLI (nVidia 680i) |
| Operating System: | Windows XP Professional SP2 |
| BIOS | Award P23 (12/22/2006) |
The 680i motherboard with NVIDIA Monitor software will allow testing of the cooling efficiency of the cooler under test. We first tested the stock Intel cooler at standard X6800 speed, measuring the CPU temperature at idle and while the CPU was being stressed. We stressed the CPU by running continuous loops of the Far Cry River demo. The same tests were repeated at the highest stable overclock we could achieve with the stock cooler. Stable in this case meant the ability to handle our Far Cry looping for at least 30 minutes.
The same tests were then run on the cooler under test at stock, highest stock cooler OC speed, and the highest OC that could be achieved in the same setup with the cooler being tested. This allows measurement of the cooling efficiency of the test unit compared to stock and the improvement in overclocking capabilities, if any, from using the test cooler.
Noise Levels
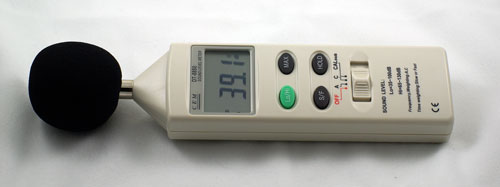
In addition to cooling efficiency and overclocking abilities, users shopping for CPU cooling solutions may also be interested in the noise levels of the cooling devices they are considering. Noise levels were measured in various configurations using a C. E. M. DT-8850 Sound Level meter. The C. E. M. meter can measure either A-weighted or C-weighted sound levels. All reported measurements are A-weighted since this is generally considered closer to the way the human ear actually perceives noise.
This meter allows sound level measurements from 35bdB to 130dB with a resolution of 0.1dB and an accuracy of +/- 1.5dB. This is sufficient for our needs in these tests, as measurement starts at the level of a relatively quiet room. Our own test room, with all computers and fans turned off, has a room noise level of 36.4dB. Our procedures for measuring cooling system noise are described on page 6 along with noise results comparing the stock Intel cooler to the Tuniq Tower 120.
Originally published at https://www.anandtech.com/show/2152 (Wayback Machine).