
ACEMAGIC F2A 125H SFF PC Review: Mid-Range Meteor Lake at 65W
Power Consumption and Thermal Characteristics
The power consumption at the wall was measured with a 4K display being driven through one of the HDMI ports of the system. In the graph below, we compare the idle and load power of the ACEMAGIC F2A 125H with other systems evaluated before. For load power consumption, we ran the AIDA64 System Stability Test with various stress components, as well as our custom stress test with Prime95 / Furmark, and noted the peak as well as idling power consumption at the wall.
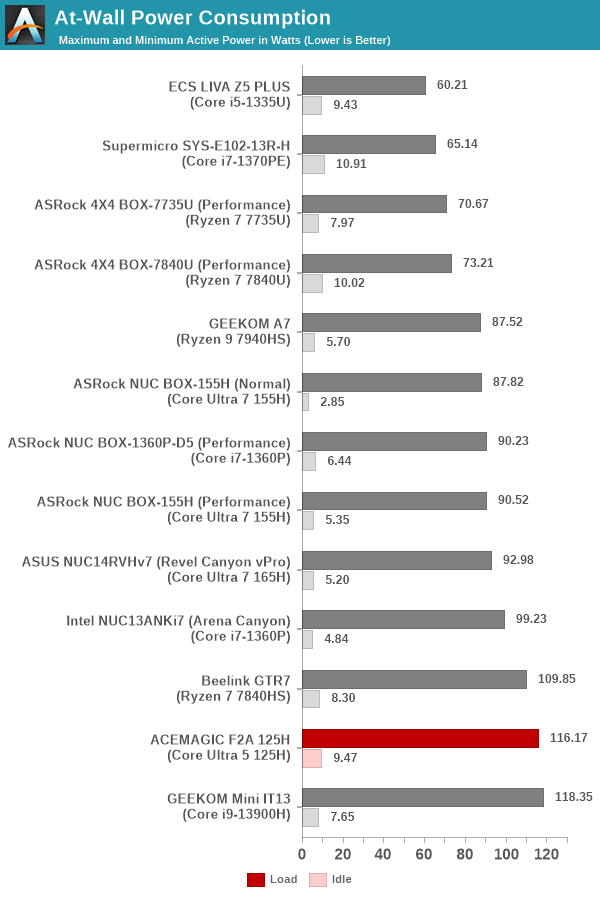
The numbers are consistent with the TDP and suggested PL1 / PL2 values for the processors in the systems, and do not come as any surprise. With a 90W PL2 setting, we find the peak power consumption of the F2A 125H to be around 116W. Idle numbers could be a bit better with some BIOS optimizations.
Stress Testing
Our thermal stress routine is a combination of Prime95, Furmark, and Finalwire's AIDA64 System Stability Test. The following 9-step sequence is followed, starting with the system at idle:
- Start with the Prime95 stress test configured for maximum power consumption
- After 30 minutes, add Furmark GPU stress workload
- After 30 minutes, terminate the Prime95 workload
- After 30 minutes, terminate the Furmark workload and let the system idle
- After 30 minutes of idling, start the AIDA64 System Stress Test (SST) with CPU, caches, and RAM activated
- After 30 minutes, terminate the previous AIDA64 SST and start a new one with the GPU, CPU, caches, and RAM activated
- After 30 minutes, terminate the previous AIDA64 SST and start a new one with only the GPU activated
- After 30 minutes, terminate the previous AIDA64 SST and start a new one with the CPU, GPU, caches, RAM, and SSD activated
- After 30 minutes, terminate the AIDA64 SST and let the system idle for 30 minutes
Traditionally, this test used to record the clock frequencies - however, with the increasing number of cores in modern processors and fine-grained clock control, frequency information makes the graphs cluttered and doesn't contribute much to understanding the thermal performance of the system. The focus is now on the power consumption and temperature profiles to determine if throttling is in play.


The thermal solution of the F2A 125H is good enough to let the processor package operate with a sustained 65W package power. We see that the number stays right around that mark all through the segments where the CPU is stressed. Additionally, the core temperature never crosses 85C throughout this duration. The SSD temperature goes up to 64C under heavy stress, but stays as cool as 40C during other periods. The SODIMMs also stay well south of 60C in the whole process.
Real-World Thermals and Power Consumption
Beyond the extreme synthetic tests above, it is also useful to get an ideal of the thermal behavior and power consumption numbers for common consumer workloads. For this purpose, we again turn to UL's Procyon benchmark. Results from the benchmark were presented in a previous section. In this sub-section, results gathered from the simultaneous built-in system monitoring thread are presented.
| UL Procyon Office Workload Package Temperature and At-Wall Power Consumption |
||||
| System | Cores Temperature (C) | At-Wall Power (Average) (W) |
||
| Minimum | Average | Maximum | ||
| ASRock NUC BOX-155H (Performance) | 42 | 55.36 | 93 | 29.41 |
| ACEMAGIC F2A 125H | 27 | 33.42 | 64 | 26.58 |
| ASUS NUC14RVHv7 (Revel Canyon vPro) | 41.01 | 51.41 | 85 | 28.02 |
| ASRock NUC BOX-155H (Normal) | 45 | 58.1 | 98.61 | 27.02 |
The delta in the average power consumption at the wall is less than 3W for the F2A 125H, but this translates to a delta of more than 21C for the maximum temperature in the Office workload case.
| UL Procyon Photo Processing Package Temperature and At-Wall Power Consumption |
||||
| System | Cores Temperature (C) | At-Wall Power (Average) (W) |
||
| Minimum | Average | Maximum | ||
| ASRock NUC BOX-155H (Performance) | 44 | 63.92 | 110 | 40.58 |
| ACEMAGIC F2A 125H | 27.6 | 37.11 | 68.09 | 37.7 |
| ASUS NUC14RVHv7 (Revel Canyon vPro) | 42 | 59.43 | 111.69 | 42.17 |
| ASRock NUC BOX-155H (Normal) | 47 | 64.38 | 109.91 | 35.34 |
A similar trend is seen for the photo processing workload, with the maximum temperature being south of 70C for the ACEMAGIC system.
| UL Procyon Video Processing Package Temperature and At-Wall Power Consumption |
||||
| System | Cores Temperature (C) | At-Wall Power (Average) (W) |
||
| Minimum | Average | Maximum | ||
| ASRock NUC BOX-155H (Performance) | 45 | 77.19 | 110 | 47.39 |
| ACEMAGIC F2A 125H | 28 | 40.32 | 60.98 | 43.14 |
| ASUS NUC14RVHv7 (Revel Canyon vPro) | 49 | 68.17 | 101 | 51.17 |
| ASRock NUC BOX-155H (Normal) | 50 | 71.75 | 106.91 | 40.45 |
The F2A 125H again hits it out of the park with a 61C peak temperature in the video processing workload.
The larger physical footprint enables a much better thermal solution for the ACEMAGIC F2A 125H compared to the 4x4 systems. This is reflected very well in the real world thermal characteristics and also backs up our inferences from the synthetic stress tests sequence.
Originally published at https://www.anandtech.com/show/21416/acemagic-f2a-meteor-lakeh-sff-pc-review (Wayback Machine).