
Supermicro SYS-E100-12T-H Review: Fanless Tiger Lake for Embedded Applications
System Performance: UL and BAPCo Benchmarks
Our 2022 test suite for Windows 11-based systems carries over some of the standard benchmarks we have been using over the last several years, including UL's PCMark and BAPCo's SYSmark. Starting this year, we are also including BAPCo's CrossMark multi-platform benchmarking tool.
PCMark 10
UL's PCMark 10 evaluates computing systems for various usage scenarios (generic / essential tasks such as web browsing and starting up applications, productivity tasks such as editing spreadsheets and documents, gaming, and digital content creation). We benchmarked select PCs with the PCMark 10 Extended profile and recorded the scores for various scenarios. These scores are heavily influenced by the CPU and GPU in the system, though the RAM and storage device also play a part. The power plan was set to Balanced for all the PCs while processing the PCMark 10 benchmark.
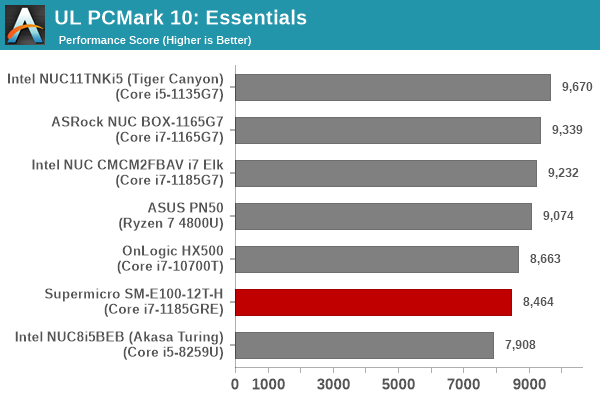
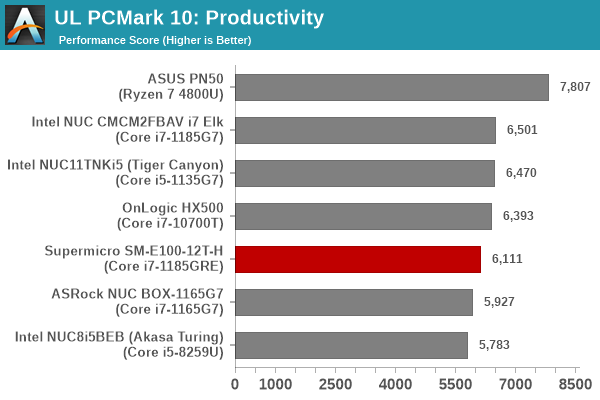
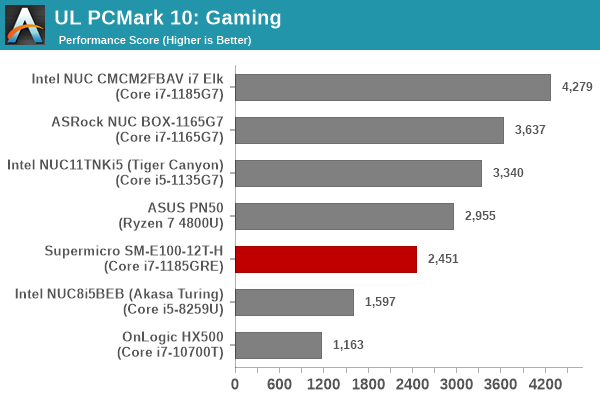
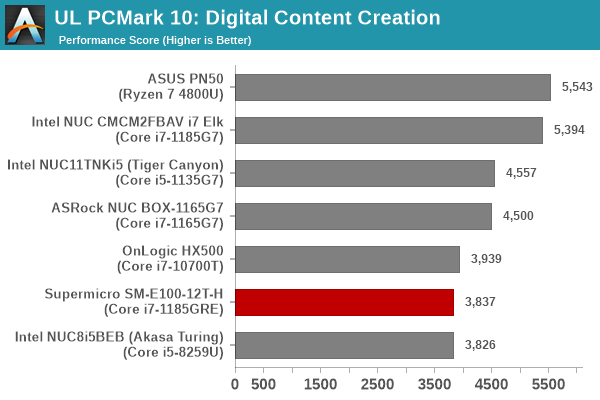
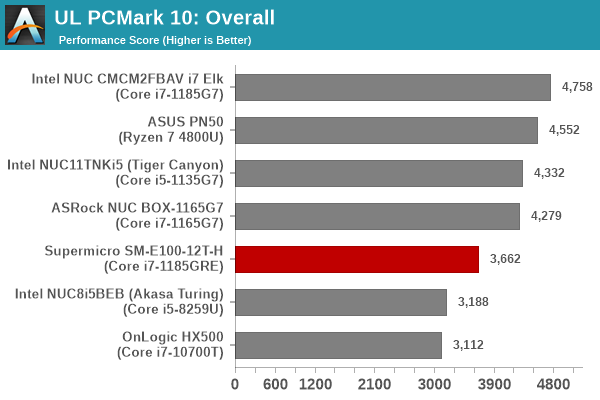
Despite appearing in the lower half of the graphs above, the Supermicro SYS-E100-12T-H puts up an impressive performance given its TDP constraints - 15W against the 20W - 35W configuration of the other systems' processors. In almost all sections, we see the system edge ahead of the Coffee Lake-equipped Bean Canyon NUC and the OnLogic HX500 despite the TDP handicap - a testament to the improvements made in Tiger Lake by Intel.
BAPCo SYSmark 25
BAPCo's SYSmark 25 is an application-based benchmark that uses real-world applications to replay usage patterns of business users in the areas of productivity, creativity, and responsiveness. The 'Productivity Scenario' covers office-centric activities including word processing, spreadsheet usage, financial analysis, software development, application installation, file compression, and e-mail management. The 'Creativity Scenario' represents media-centric activities such as digital photo processing, AI and ML for face recognition in photos and videos for the purpose of content creation, etc. The 'Responsiveness Scenario' evaluates the ability of the system to react in a quick manner to user inputs in areas such as application and file launches, web browsing, and multi-tasking.
Scores are meant to be compared against a reference desktop (the SYSmark 25 calibration system, a Lenovo Thinkcenter M720q with a Core i5-8500T and 8GB of DDR4 memory to go with a 256GB M.2 NVMe SSD). The calibration system scores 1000 in each of the scenarios. A score of, say, 2000, would imply that the system under test is twice as fast as the reference system.
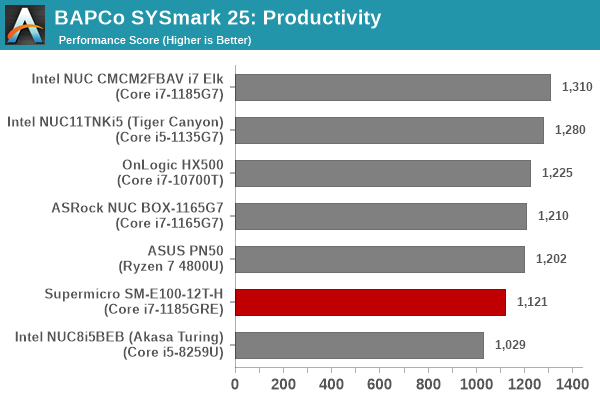
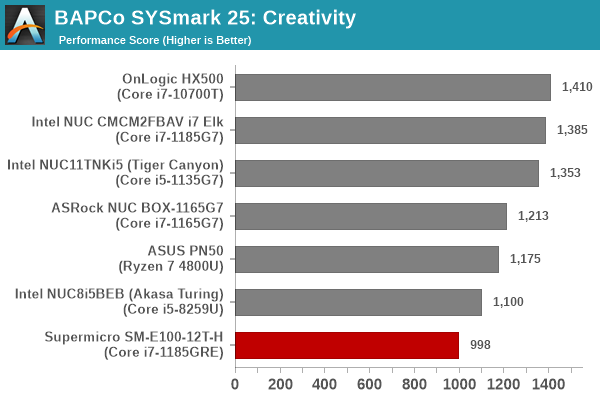
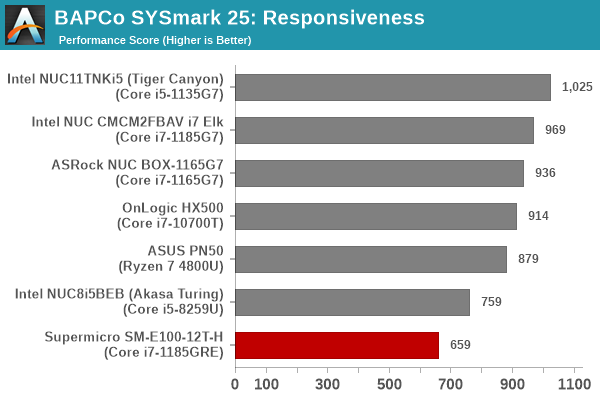
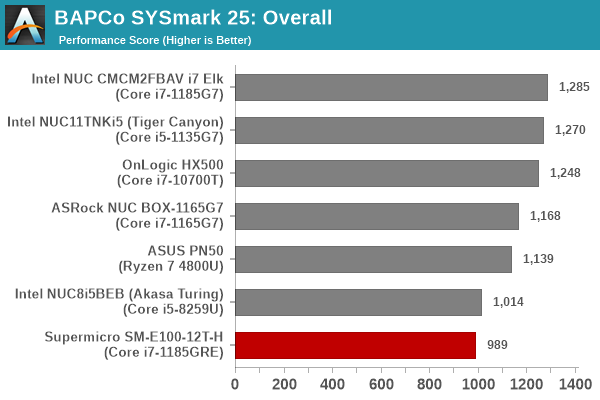
SYSmark 25 also adds energy measurement to the mix. A high score in the SYSmark benchmarks might be nice to have, but potential customers also need to determine the balance between power consumption and the performance of the system. For example, in the average office scenario, it might not be worth purchasing a noisy and power-hungry PC just because it ends up with a 2000 score in the SYSmark 25 benchmarks. In order to provide a balanced perspective, SYSmark 25 also allows vendors and decision makers to track the energy consumption during each workload. In the graphs below, we find the total energy consumed by the PC under test for a single iteration of each SYSmark 25 workload. For reference, the calibration system consumes 8.88 Wh for productivity, 10.81 Wh for creativity, and 19.69 Wh overall.
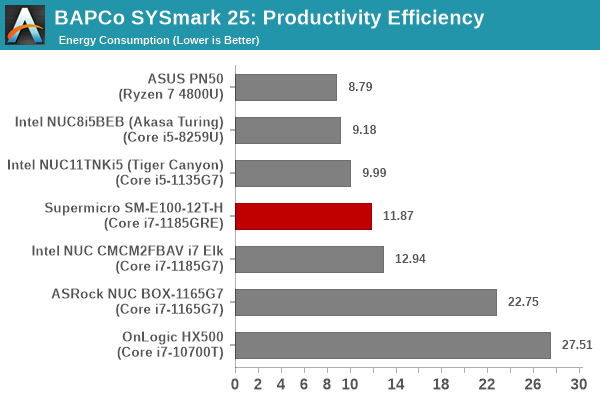
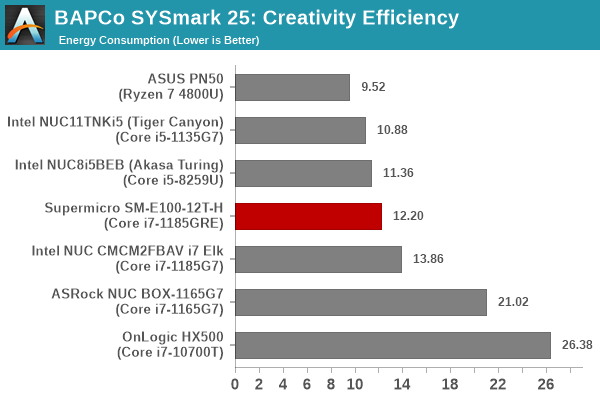
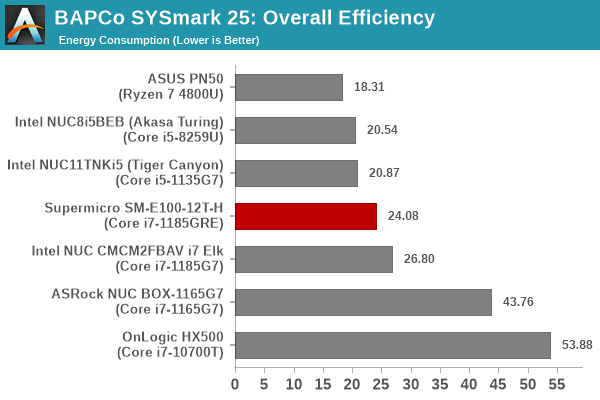
In terms of energy efficiency towards getting the workloads processed, the SM-E100-12T-H marks itself in the middle of the pack. The low TDP helps, but the extra time taken to complete the workloads (as seen in the performance scores) reduces the sheen to some extent. The SATA SSD in the system is one of the main culprits responsible for the low responsiveness score.
BAPCo CrossMark 1.0.1.86
BAPCo's CrossMark aims to simplify benchmark processing while still delivering scores that roughly tally with SYSmark. The main advantage is the cross-platform nature of the tool - allowing it to be run on smartphones and tablets as well.
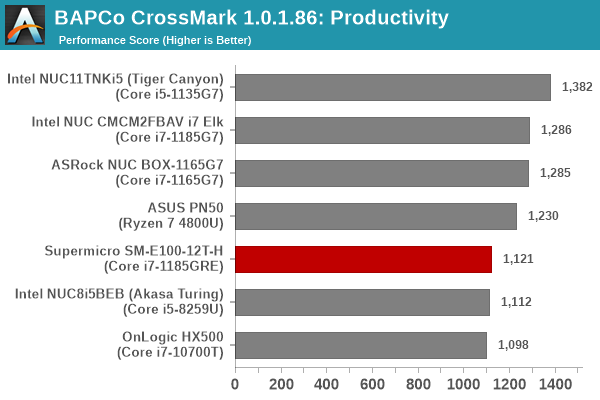
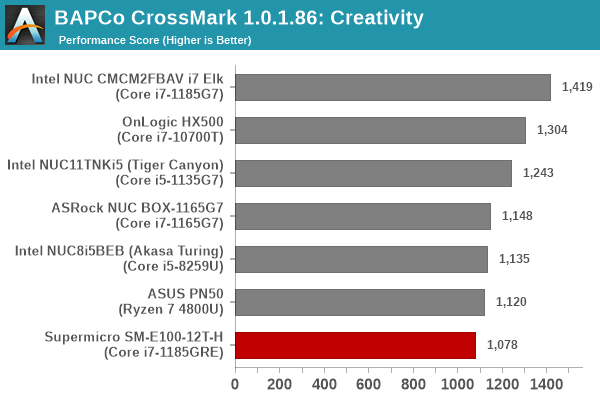
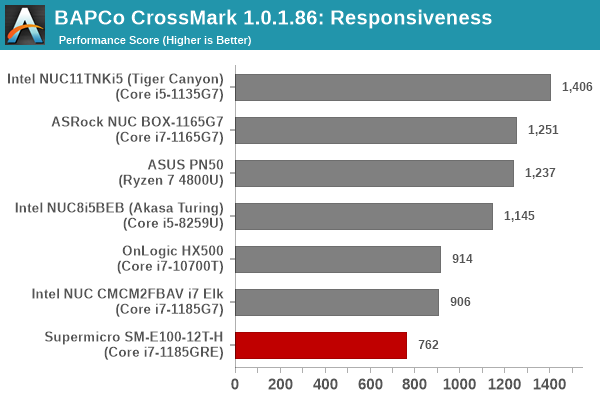
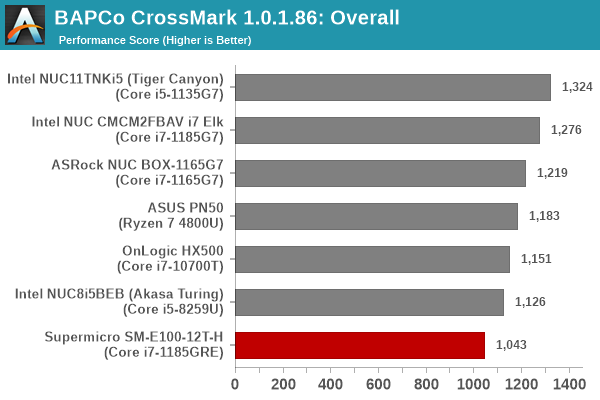
The relative performance seen in SYSmark 25 translate to CrossMark also, as expected. The responsiveness ratings vary significantly due to the usage of SATA SSDs in certain systems compared to NVMe ones in others.
Originally published at https://www.anandtech.com/show/17424/supermicro-syse10012th-review-fanless-tiger-lake-for-embedded-applications (Wayback Machine).