
The Intel Optane Memory H10 Review: QLC and Optane In One SSD
- Posted in
- SSDs
- Storage
- Intel
- M.2
- NVMe
- Silicon Motion
- 3D XPoint
- Optane
- QLC NAND
- Optane Memory
- Whiskey Lake
- SM2263
Application Benchmarks
With a complex multi-layer storage system like the Intel Optane Memory H10, the most accurate benchmarks will be tests that use real-world applications. BAPCo's SYSmark 2018 and UL's PCMark 10 are two competing suites of automated application benchmarks. Both share the general goal of assigning a score to represent total system performance, plus several subscores covering different common use cases. PCMark 10 is the shorter test to run and it provides a more detailed breakdown of subscores. It is also much more GPU-heavy with 3D rendering included in the standard test suite and some 3DMark tests included in the Extended test. SYSmark 2018 has the advantage of using the full commercial versions of popular applications including Microsoft Office and Adobe Creative Suite, and it integrates with a power meter to record total system energy usage over the course of the test.
The downside of these tests is that they cover only the most common everyday use cases, and do not simulate any heavy multitasking. None of their subtests are particularly storage-intensive, so most scores only vary slightly when changing between fast and slow SSDs.
BAPCo SYSmark 2018
BAPCo's SYSmark 2018 is an application-based benchmark that uses real-world applications to replay usage patterns of business users, with subscores for productivity, creativity and responsiveness. Scores represnt overall system performance and are calibrated against a reference system that is defined to score 1000 in each of the scenarios. A score of, say, 2000, would imply that the system under test is twice as fast as the reference system.
 |
|||||||||
| Creativity | Productivity | Responsiveness | Overall | ||||||
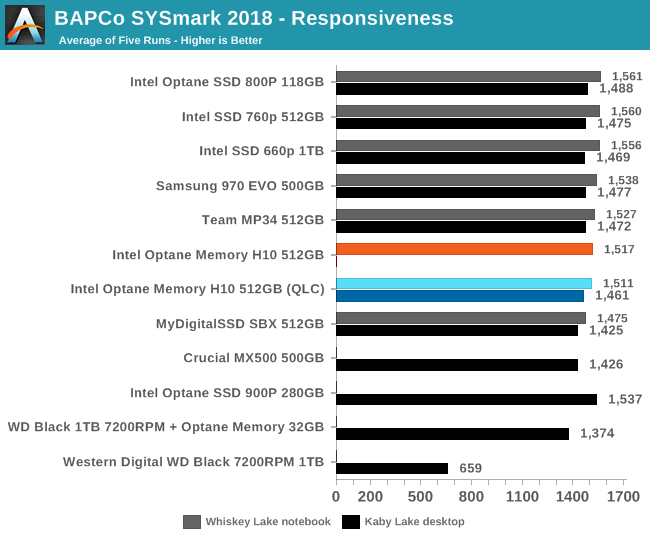
The Kaby Lake desktop and Whiskey Lake notebook trade places depending on the subtest; sometimes the notebook is ahead thanks to its extra RAM, and sometimes the desktop is ahead thanks to its higher TDP. These differences usually have a bigger impact than choice of storage, though the Responsiveness test does show that a hard drive alone is inadequate. The Optane Memory H10's score with caching on is not noticeably better than when using the QLC portion alone, and even the hard drive with an Optane cache is fairly competitive with the all-solid state storage configurations.
Energy Usage
The SYSmark energy usage scores measure total system power consumption, excluding the display. Our Kaby Lake test system idles at around 26 W and peaks at over 60 W measured at the wall during the benchmark run. SATA SSDs seldom exceed 5 W and idle at a fraction of a watt, and the SSDs spend most of the test idle. This means the energy usage scores will inevitably be very close. The notebook uses substantially less power despite this measurement including the display. None of the really power-hungry storage options (hard drives, Optane 900P) can fit in this system, so the energy usage scores are also fairly close together.
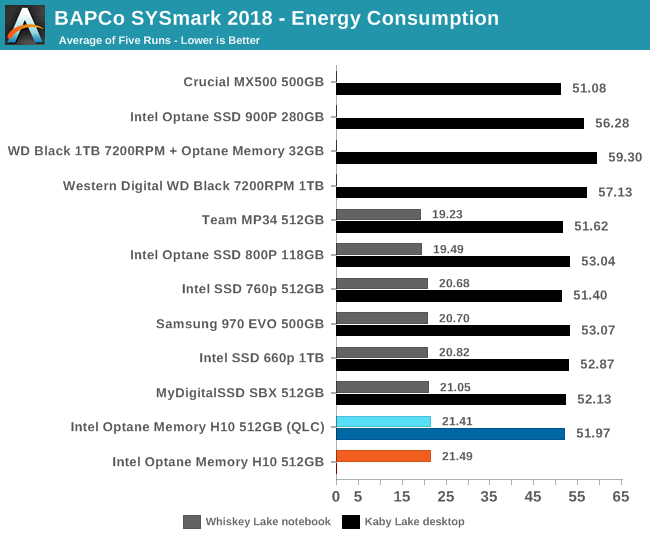
The Optane Memory H10 was the most power-hungry M.2 option, and leaving the Optane cache off saves a tiny bit of power but not enough to catch up with the good TLC-based drives. The Optane SSD 800P has better power efficiency than most of the flash-based drives, but its low capacity is a hindrance for real-world use.
UL PCMark 10
 |
|||||||||
| Subscore: | |||||||||
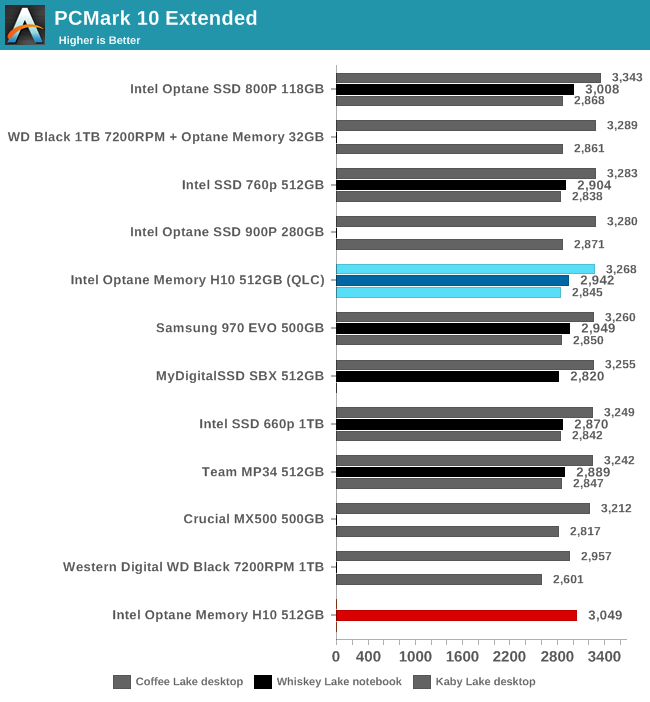
The Optane cache provides enough of a boost to PCMark 10 Extended scores to bring the H10 into the lead among the M.2 SSDs tested on the Whiskey Lake notebook. The Essentials subtests show the most impact from the Optane storage while the more compute-heavy tasks are relatively unaffected, with the H10 performing about the same with or without caching enabled.
Originally published at https://www.anandtech.com/show/14249/the-intel-optane-memory-h10-review-two-ssds-in-one (Wayback Machine).