
The OCZ Vector 180 (240GB, 480GB & 960GB) SSD Review
- Posted in
- Storage
- SSDs
- OCZ
- Barefoot 3
- Vector 180
Random Read Performance
One of the major changes in our 2015 test suite is the synthetic Iometer tests we run. In the past we used to test just one or two queue depths, but real world workloads always contain a mix of different queue depths as shown by our Storage Bench traces. To get the full scope in performance, I'm now testing various queue depths starting from one and going all the way to up to 32. I'm not testing every single queue depth, but merely how the throughput scales with the queue depth. I'm using exponential scaling, meaning that the tested queue depths increase in powers of two (i.e. 1, 2, 4, 8...).
Read tests are conducted on a full drive because that is the only way to ensure that the results are valid (testing with an empty drive can substantially inflate the results and in reality the data you are reading is always valid rather than full of zeros). Each queue depth is tested for three minutes and there is no idle time between the tests.
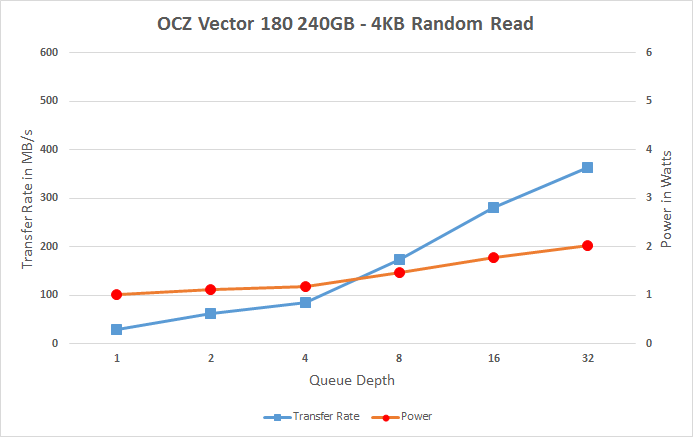
I'm also reporting two metrics now. For the bar graph, I've taken the average of QD1, QD2 and QD4 data rates, which are the most relevant queue depths for client workloads. This allows for easy and quick comparison between drives. In addition to the bar graph, I'm including a line graph, which shows the performance scaling across all queue depths. To keep the line graphs readable, each drive has its own graph, which can be selected from the drop-down menu.
I'm also plotting power for SATA drives and will be doing the same for PCIe drives as soon as I have the system set up properly. Our datalogging multimeter logs power consumption every second, so I report the average for every queue depth to see how the power scales with the queue depth and performance.
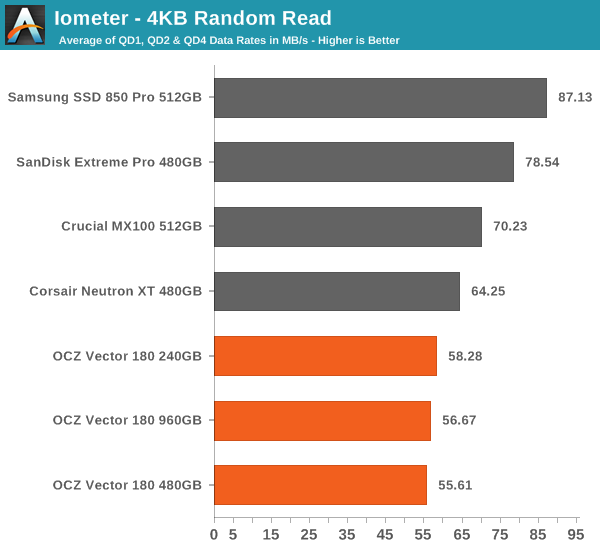
Random read performance at small queue depths has never been an area where the Vector 180 has excelled in. Given that these are one of the most common IOs, it's an area where I would like to see improvement on OCZ's behalf.
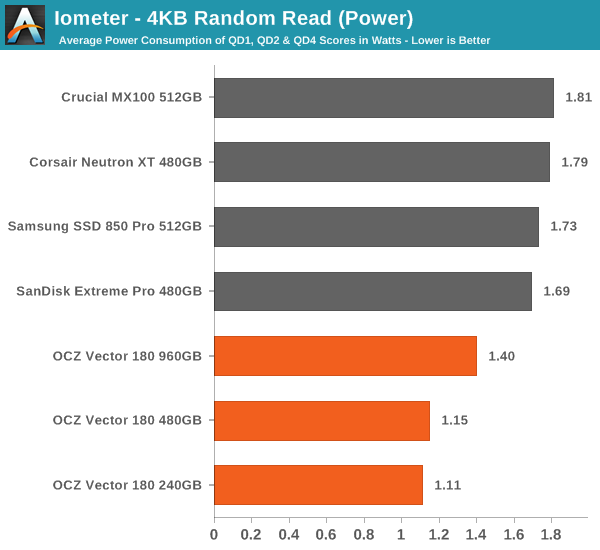
Power consumption, on the other hand, is excellent, which is partially explained by the lower performance.
 |
|||||||||
Having a closer look at the performance data across all queue depths reveals the reason for Vector 180's poor random read performance. For some reason, the performance only starts to scale properly after queue depth of 4, but even then the scaling isn't as aggressive as on some other drives.
Random Write Performance
Write performance is tested in the same way as read performance, except that the drive is in a secure erased state and the LBA span is limited to 16GB. We already test performance consistency separately, so a secure erased drive and limited LBA span ensures that the results here represent peak performance rather than sustained performance.
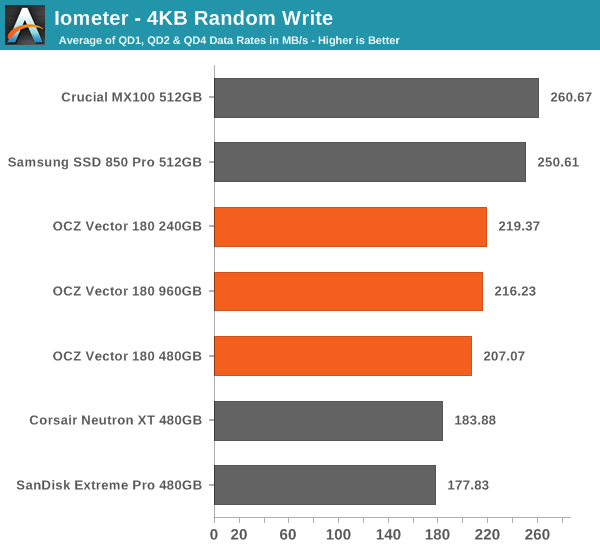
In random write performance the Vector 180 does considerably better, although it's still not the fastest drive around.
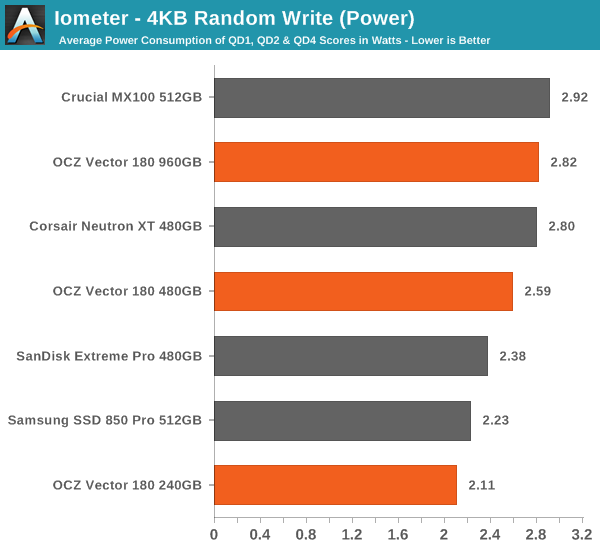
Even though the random write performance doesn't scale at all with capacity, the power consumption does. Still, the Vector 180 is quite power efficient compared to other drives.
 |
|||||||||
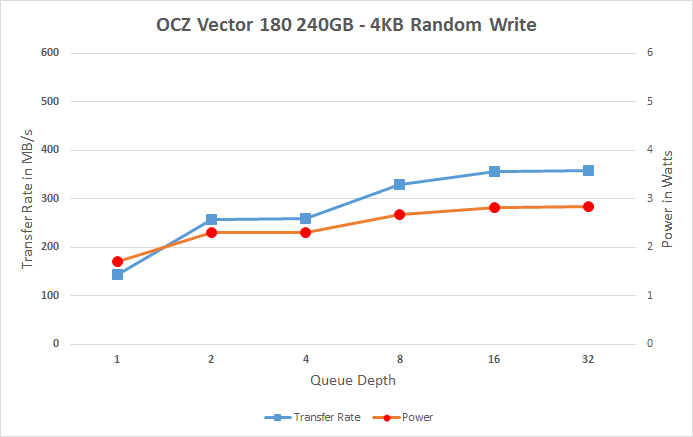
The Vector 180 scales smoothly across all queue depths, but it could scale a bit more aggressively because especially the QD4 score is a bit low. On a positive side, the Vector 180 does very well at QD1, though.
Originally published at https://www.anandtech.com/show/9009/ocz-vector-180-240gb-480gb-960gb-ssd-review (Wayback Machine).