
Qualcomm Snapdragon 805 Performance Preview
GPU Performance
3DMark
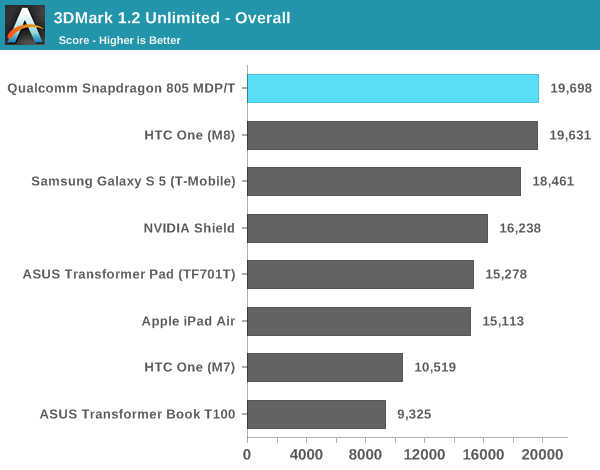
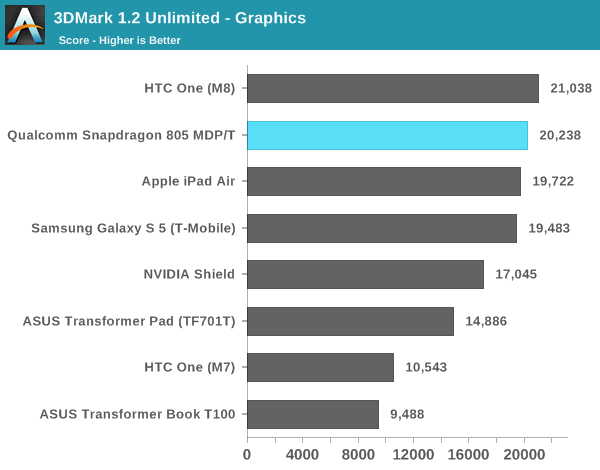
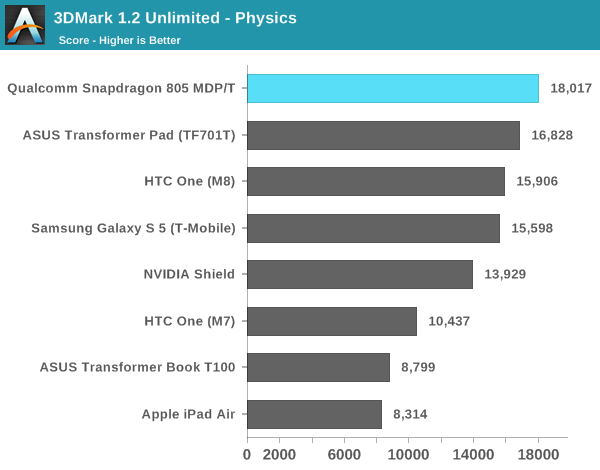
Although it's our first GPU test, 3DMark doesn't do much to show Adreno 420 in a good light. 3DMark isn't the most GPU intensive test we have, but here we see marginal increases over Snapdragon 800/Adreno 330. I would be interested in seeing if there are any improvements on the power consumption front since performance doesn't really change.
Basemark X 1.1
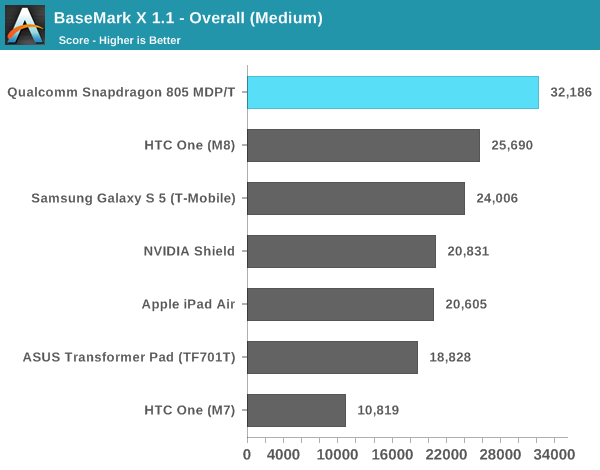
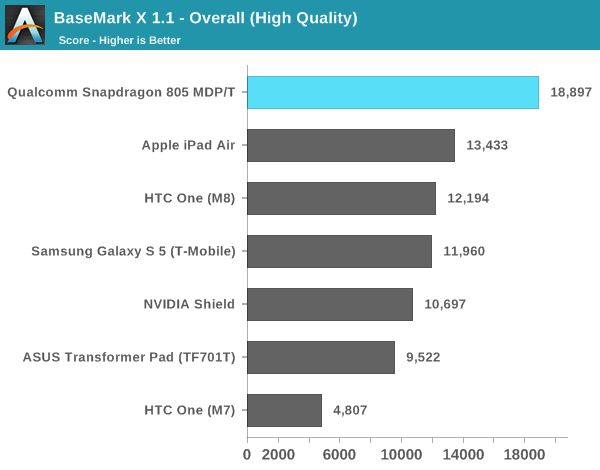
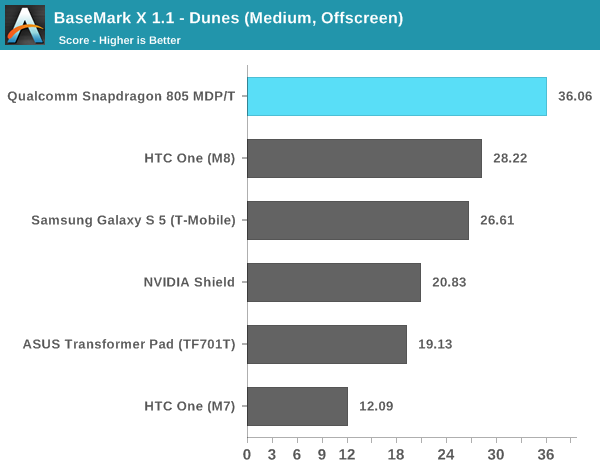
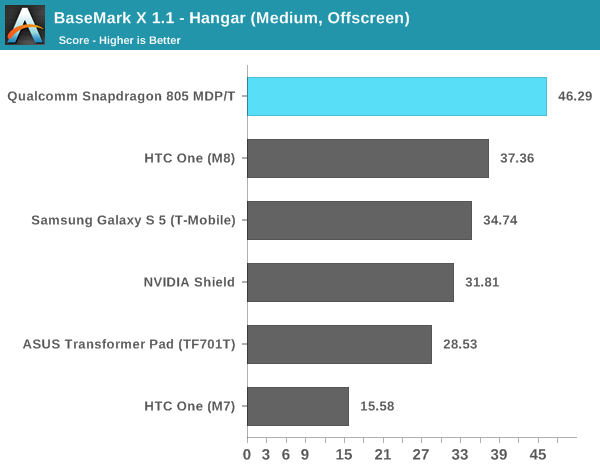
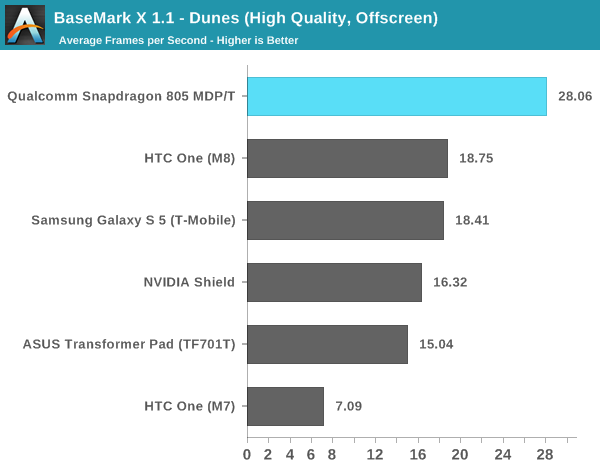
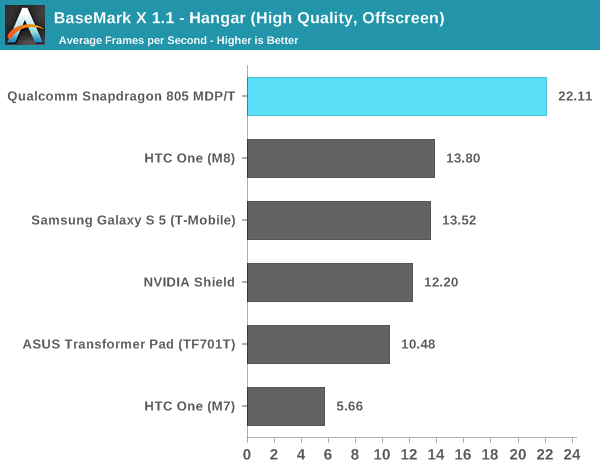
Basemark X 1.1 starts to show a difference between Adreno 420 and 330. At medium quality settings we see a 25% increase in performance over the Snapdragon 801 based Adreno 330 devices. Move to higher quality settings and the performance advantage increases to over 50%. Here even NVIDIA's Shield with Tegra 4 cooled by a fan can't outperform the Adreno 420 GPU.
GFXBench 3.0
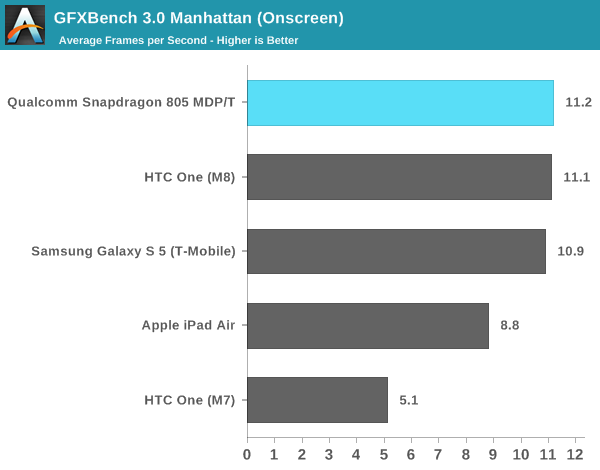
Manhattan continues to be a very stressful test but the onscreen results are pretty interesting. Adreno 420 can drive a 2560 x 1440 display at the same frame rate that Adreno 330 could drive a 1080p display.
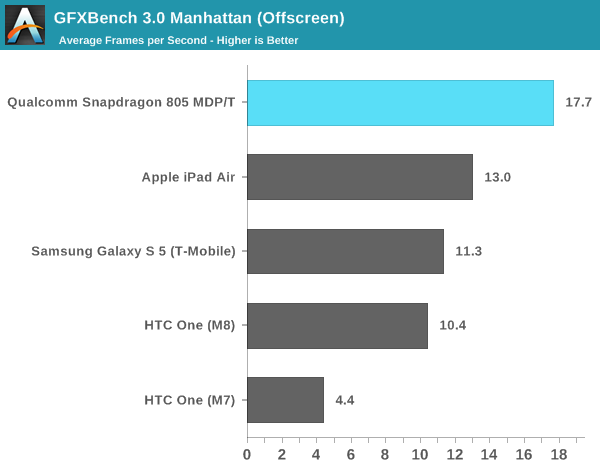
In an apples to apples comparison at the same resolution, Adreno 430 is over 50% faster than Adreno 330. It's also faster than the PowerVR G6430 in the iPad Air.
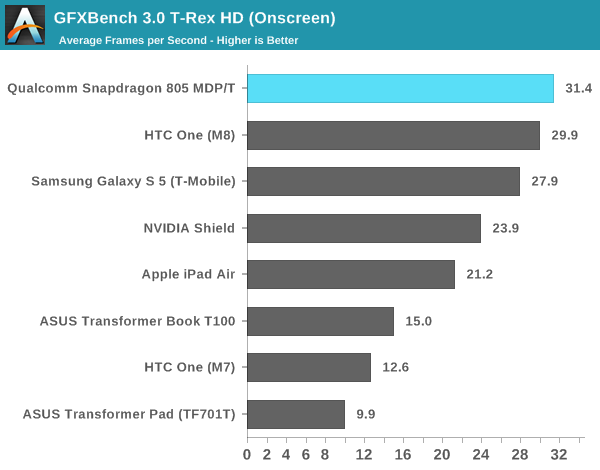
Once again we see an example where Adreno 420 is able to drive the MDP/T's panel at 2560 x 1440 at the same performance as Adreno 330 can deliver at 1080p
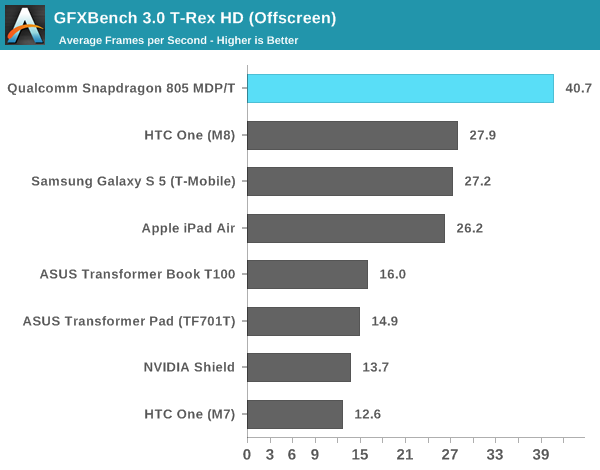
At 1080p, the Adreno 420/S805 advantage grows to 45%.
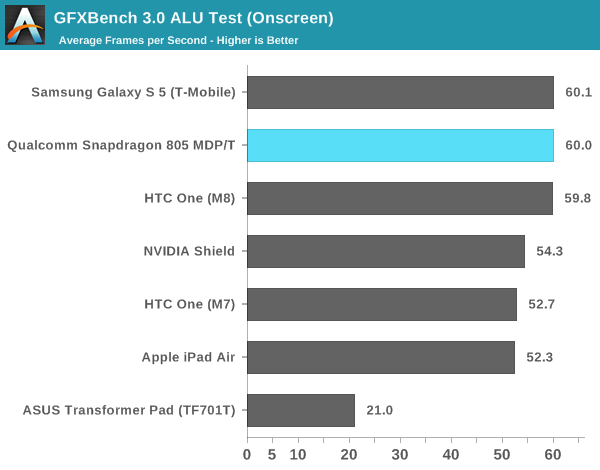
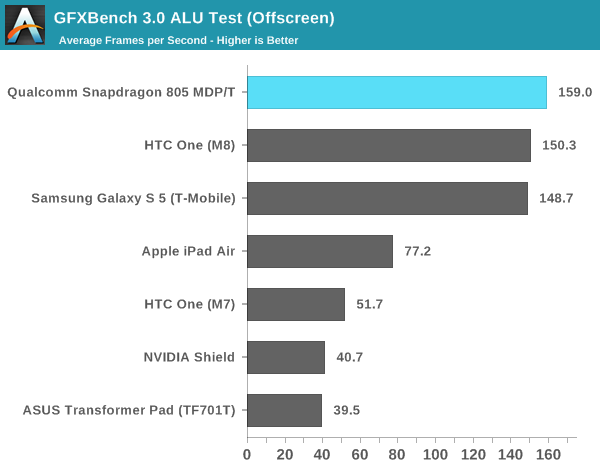
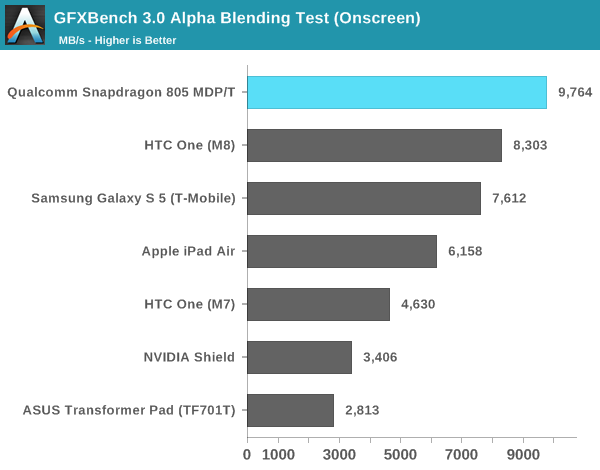
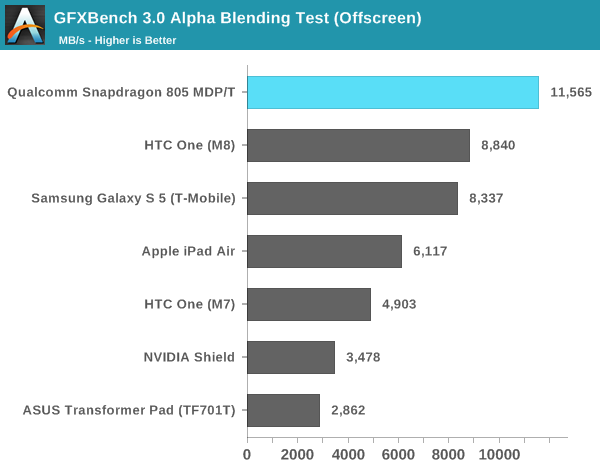
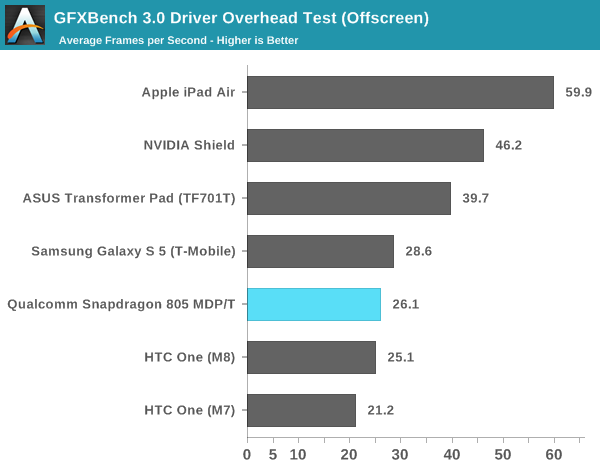
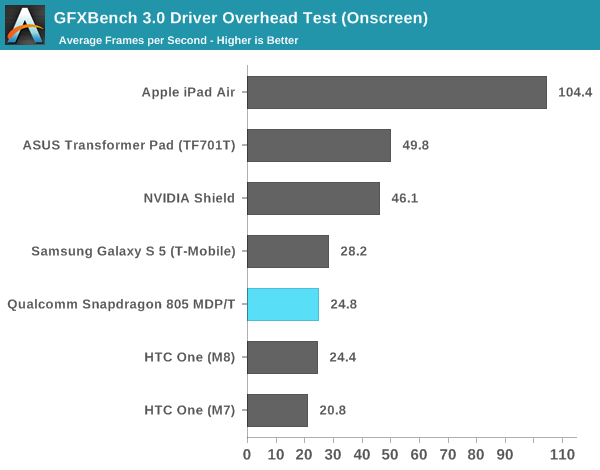
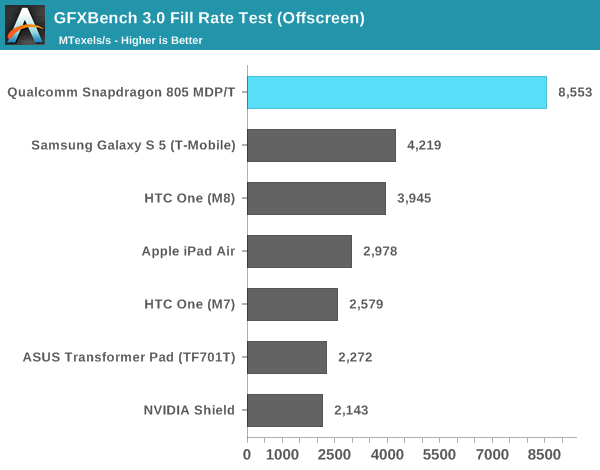
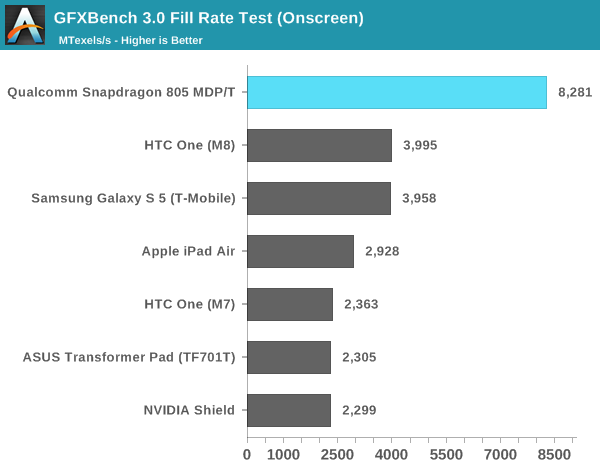
I've included all of the low level GFXBench tests below if you're interested in digging any deeper. It's interesting that we don't see a big increase in the ALU test but far larger increases in the alpha blending and fill rate tests.
Originally published at https://www.anandtech.com/show/8035/qualcomm-snapdragon-805-performance-preview (Wayback Machine).