
Crucial M550 Review: 128GB, 256GB, 512GB and 1TB Models Tested
Performance Consistency
Performance consistency tells us a lot about the architecture of these SSDs and how they handle internal defragmentation. The reason we don’t have consistent IO latency with SSD is because inevitably all controllers have to do some amount of defragmentation or garbage collection in order to continue operating at high speeds. When and how an SSD decides to run its defrag or cleanup routines directly impacts the user experience as inconsistent performance results in application slowdowns.
To test IO consistency, we fill a secure erased SSD with sequential data to ensure that all user accessible LBAs have data associated with them. Next we kick off a 4KB random write workload across all LBAs at a queue depth of 32 using incompressible data. The test is run for just over half an hour and we record instantaneous IOPS every second.
We are also testing drives with added over-provisioning by limiting the LBA range. This gives us a look into the drive’s behavior with varying levels of empty space, which is frankly a more realistic approach for client workloads.
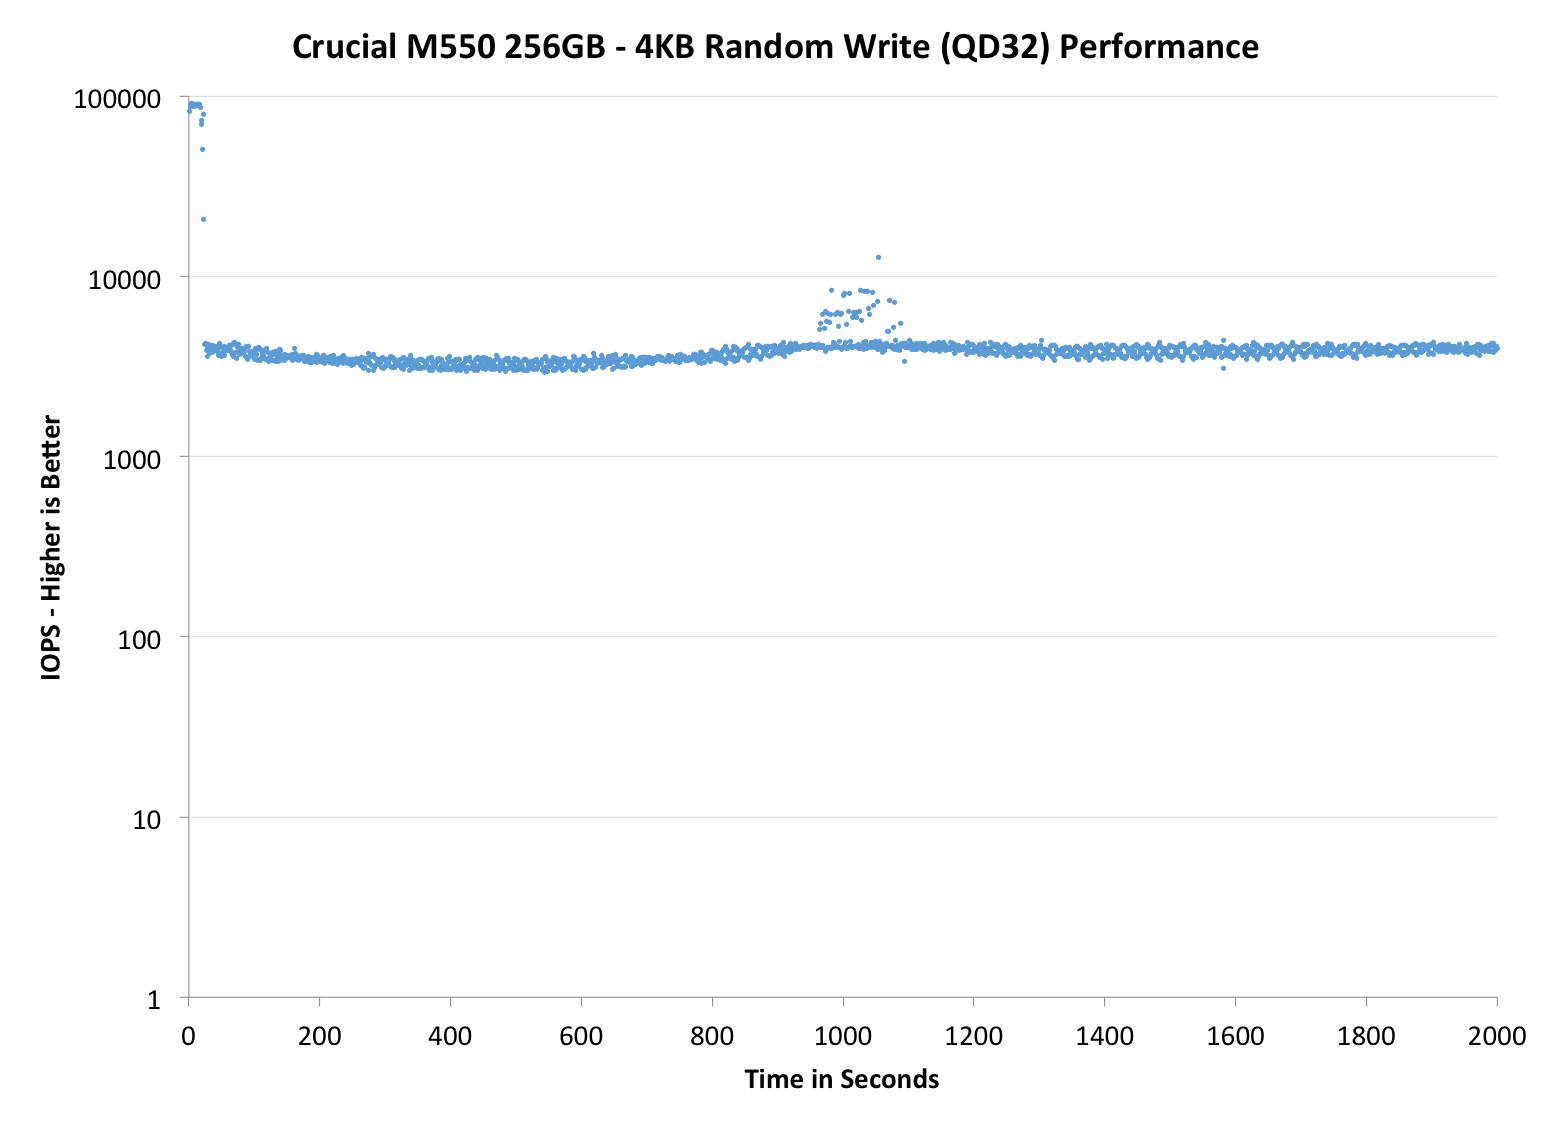
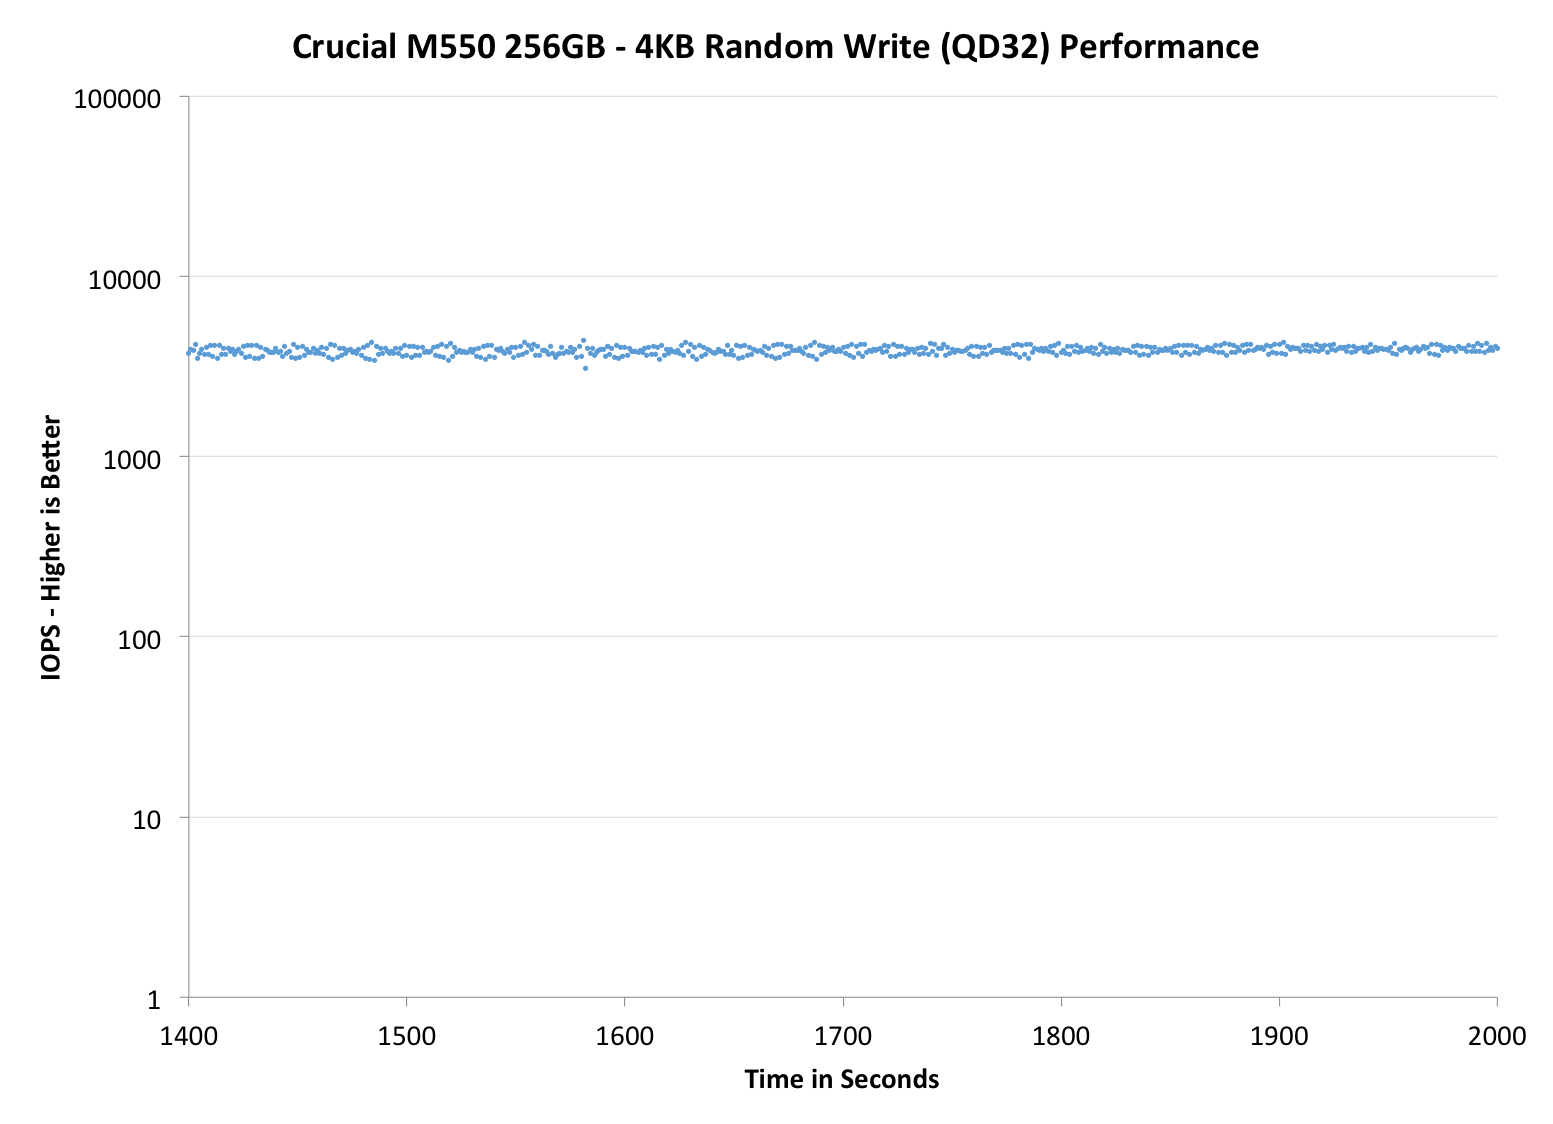
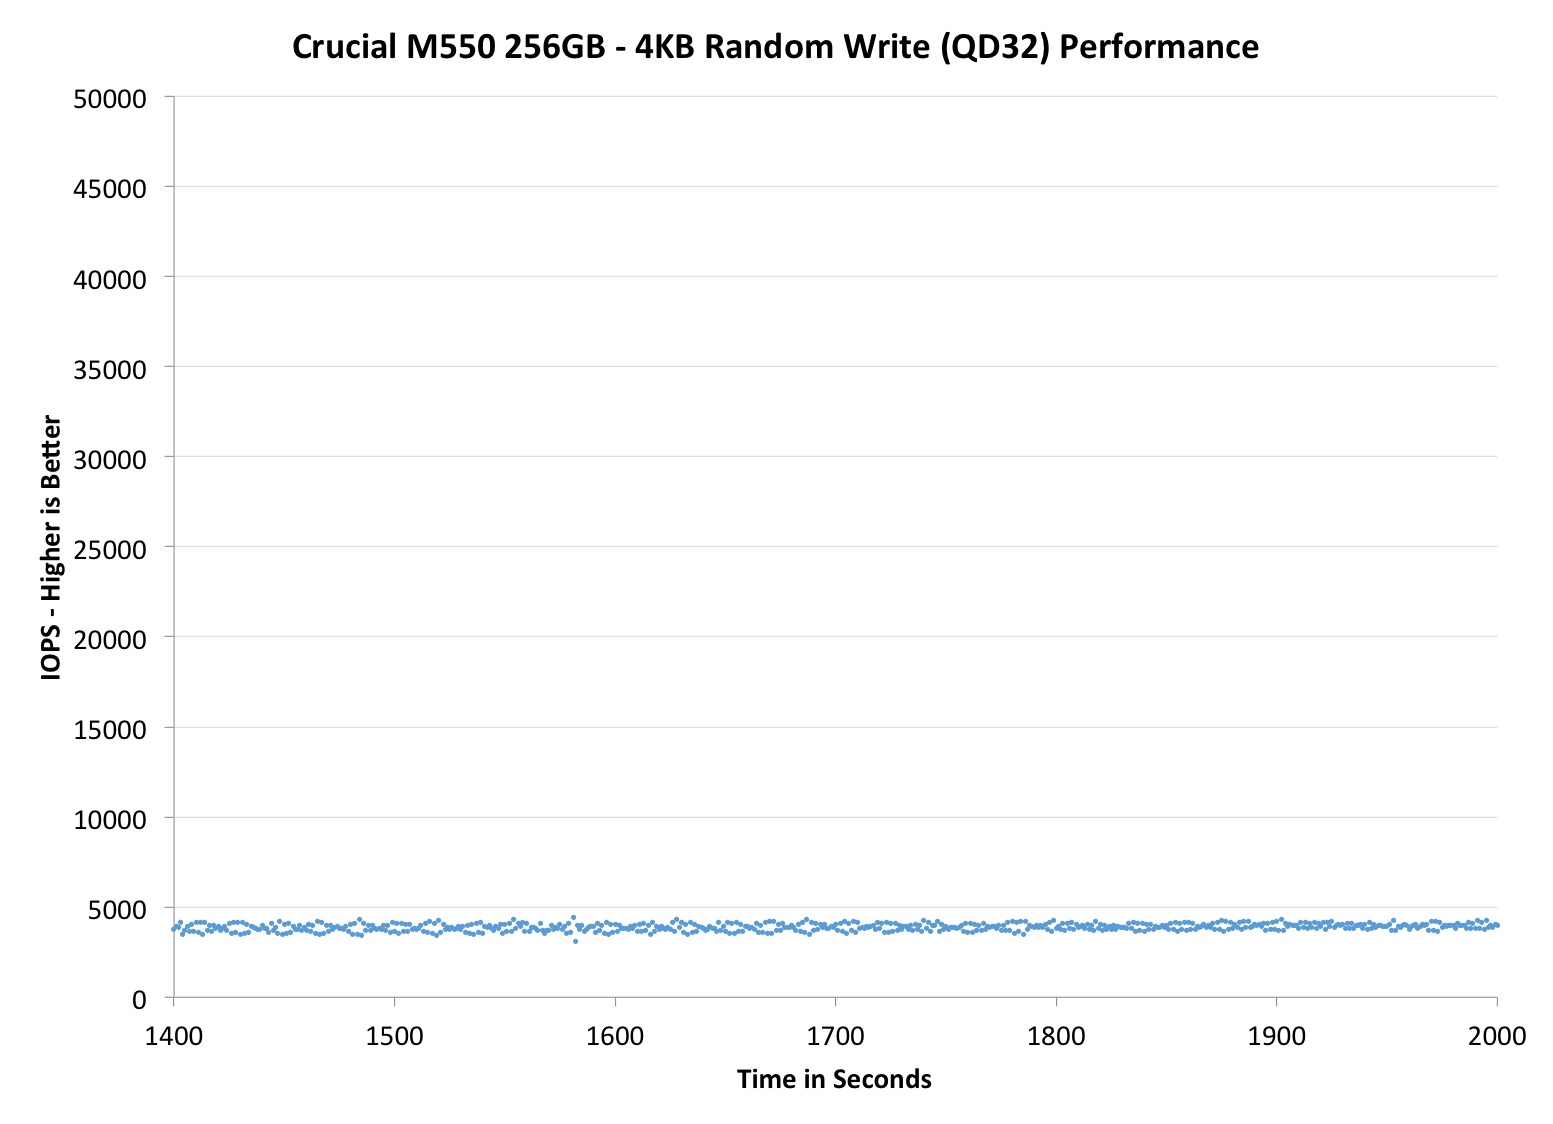
Each of the three graphs has its own purpose. The first one is of the whole duration of the test in log scale. The second and third one zoom into the beginning of steady-state operation (t=1400s) but on different scales: the second one uses log scale for easy comparison whereas the third one uses linear scale for better visualization of differences between drives. Click the buttons below each graph to switch the source data.
For more detailed description of the test and why performance consistency matters, read our original Intel SSD DC S3700 article.
 |
|||||||||
| Crucial M550 | Crucial M500 | Intel SSD 730 | SanDisk Extreme II | Samsung SSD 840 EVO | |||||
| Default | |||||||||
| 25% Spare Area | - | ||||||||
I can't say I'm very pleased with the IO consistency of the M550. There is a moderate increase (~4K IOPS vs 2.5K in M500) in steady-state performance but other than that there isn't much good to say. All the other higher-end drives run circles around the M550. I should note that the M550 does have considerably less over-provisioning than the other drives but even at 25% OP the results aren't pretty. There is huge variation in performance and the graphs with additional spare area certainly look quite abnormal, but the IOPS is still mostly below 5000. There are peaks of over 50K IOPS too but personally I would prefer a steady line (like the SSD 730) instead of this constant up and down. In client workloads the variation in IOPS isn't as critical as in the enterprise (where predictable performance is a must) but there can be an impact on performance in IO intensive scenarios.
 |
|||||||||
| Crucial M550 | Crucial M500 | Intel SSD 730 | SanDisk Extreme II | Samsung SSD 840 EVO | |||||
| Default | |||||||||
| 25% Spare Area | - | ||||||||
 |
|||||||||
| Crucial M550 | Crucial M500 | Intel SSD 730 | SanDisk Extreme II | Samsung SSD 840 EVO | |||||
| Default | |||||||||
| 25% Spare Area | - | ||||||||
TRIM Validation
To test TRIM, I took a secure erased drive and filled it with sequential data. Then I tortured the drive with 4KB random writes (QD32) for 30 minutes followed by a TRIM command (quick format in Windows). Finally I measured performance with HD Tach to bring you the graph below:

And as you should expect, TRIM works.
Originally published at https://www.anandtech.com/show/7864/crucial-m550-review-128gb-256gb-512gb-and-1tb-models-tested (Wayback Machine).