
Mushkin Atlas mSATA (240GB & 480GB) Review
Random Read/Write Speed
The four corners of SSD performance are as follows: random read, random write, sequential read and sequential write speed. Random accesses are generally small in size, while sequential accesses tend to be larger and thus we have the four Iometer tests we use in all of our reviews.
Our first test writes 4KB in a completely random pattern over an 8GB space of the drive to simulate the sort of random access that you'd see on an OS drive (even this is more stressful than a normal desktop user would see). I perform three concurrent IOs and run the test for 3 minutes. The results reported are in average MB/s over the entire time. We use both standard pseudo randomly generated data for each write as well as fully random data to show you both the maximum and minimum performance offered by SandForce based drives in these tests. The average performance of SF drives will likely be somewhere in between the two values for each drive you see in the graphs. For an understanding of why this matters, read our original SandForce article.
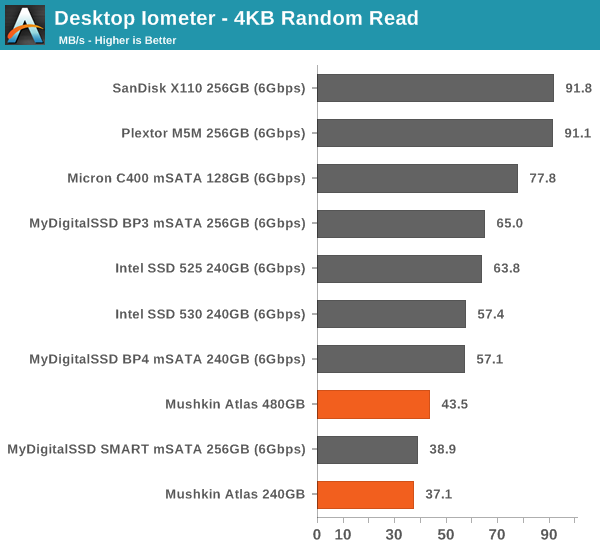
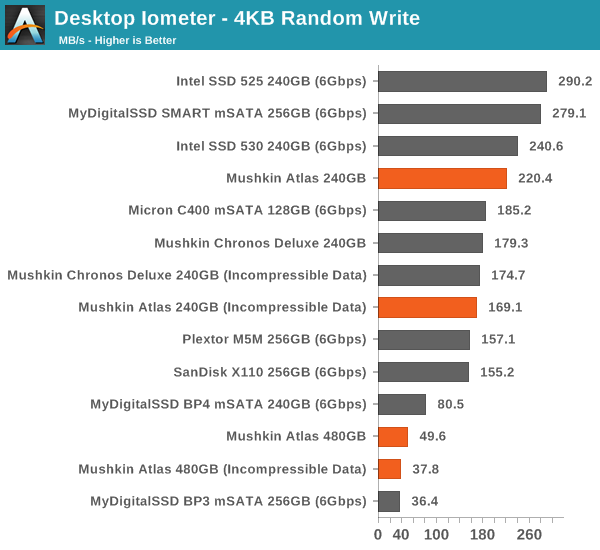
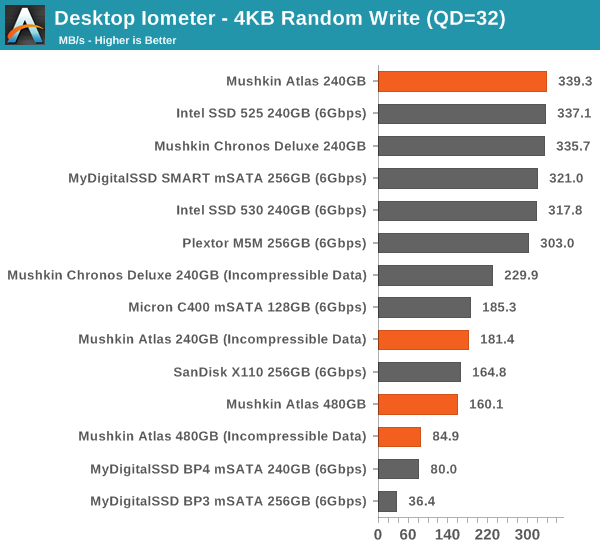
At 240GB, random write speeds are normal to SF-2281 but the 480GB model is noticeably slower. This isn't exceptional because the 480GB Vertex 3 (the only other 480GB SF-2281 SSD we've tested) exhibited similar behavior, although its performance was slightly better. I think the drop in performance has to do with raw processing power because when you double the capacity, the amount of pages/blocks that need to be tracked doubles as well. Newer controllers (like Marvell 88SS9187 and Samsung MDX) have no trouble tracking more pages/blocks but the SF-2281 design is over two years old, which is definitely showing up.
Sequential Read/Write Speed
To measure sequential performance I ran a 1 minute long 128KB sequential test over the entire span of the drive at a queue depth of 1. The results reported are in average MB/s over the entire test length.
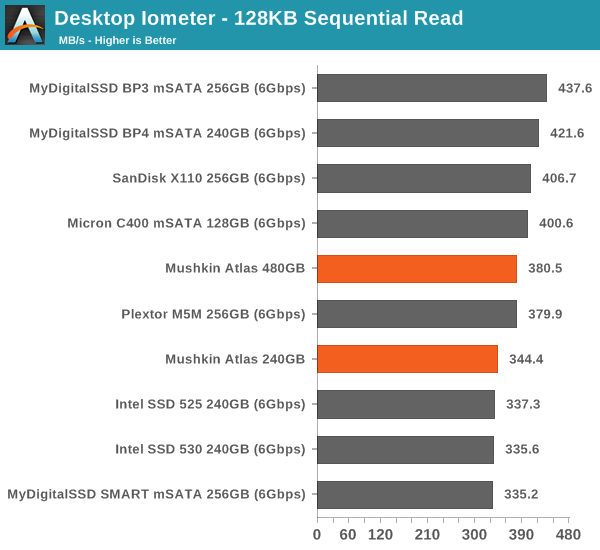
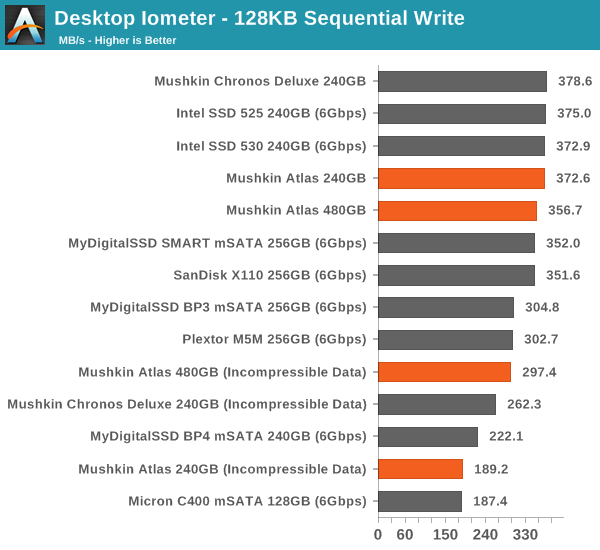
Sequential performance is average. When moving to incompressible data performance drops (as always) and especially the 240GB model experiences quite a big drop.
AS-SSD Incompressible Sequential Read/Write Performance
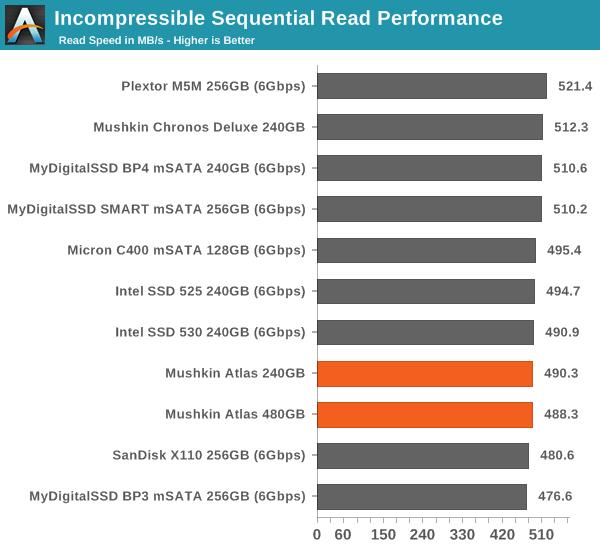
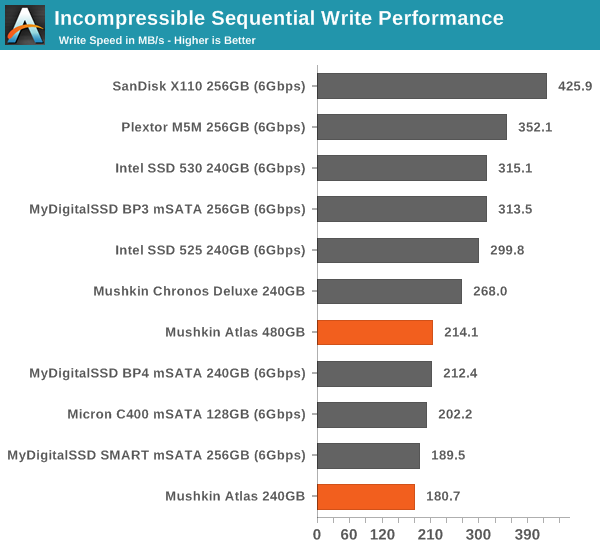
The AS-SSD sequential benchmark uses incompressible data for all of its transfers. The result is a pretty big reduction in sequential write speed on SandForce based controllers.
Originally published at https://www.anandtech.com/show/7555/mushkin-atlas-msata-240gb-480gb-review (Wayback Machine).