
The AMD Radeon R9 270X & R9 270 Review: Feat. Asus & HIS
Compute
Jumping into compute, we’re once again treading into familar territory. Pitcairn is Pitcairn is Pitcairn, and for the 270 series this will result in the same general performance increases we've seen elsewhere. 270 will of course be the bigger winner, owing to its upgrade to a fully enabled Pitcairn part. Also, on a quick housekeeping note we'll only be looking at the HIS 270 here. Our primary interest is on a broad architectural basis, rather than the minor impact from factory overclocks.
As always we'll start with our DirectCompute game example, Civilization V, which uses DirectCompute to decompress textures on the fly. Civ V includes a sub-benchmark that exclusively tests the speed of their texture decompression algorithm by repeatedly decompressing the textures required for one of the game’s leader scenes. While DirectCompute is used in many games, this is one of the only games with a benchmark that can isolate the use of DirectCompute and its resulting performance.
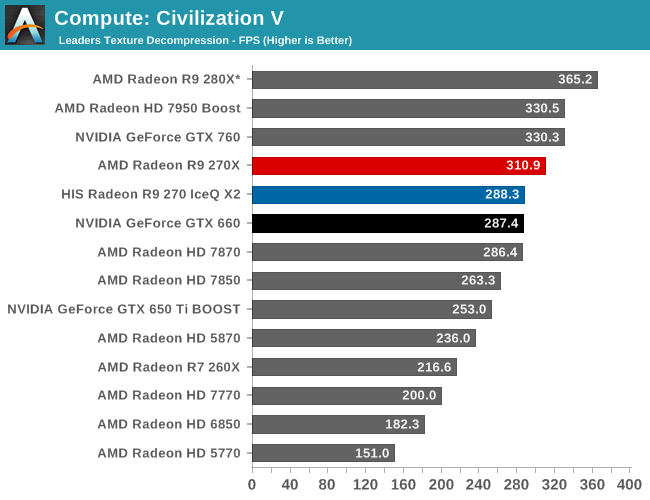
Both 270 cards do well for themselves here. The 270X holds the overall edge of course, though it’s interesting to note that the 270 and GTX 660 are virtually tied here.
Our next benchmark is LuxMark2.0, the official benchmark of SmallLuxGPU 2.0. SmallLuxGPU is an OpenCL accelerated ray tracer that is part of the larger LuxRender suite. Ray tracing has become a stronghold for GPUs in recent years as ray tracing maps well to GPU pipelines, allowing artists to render scenes much more quickly than with CPUs alone.
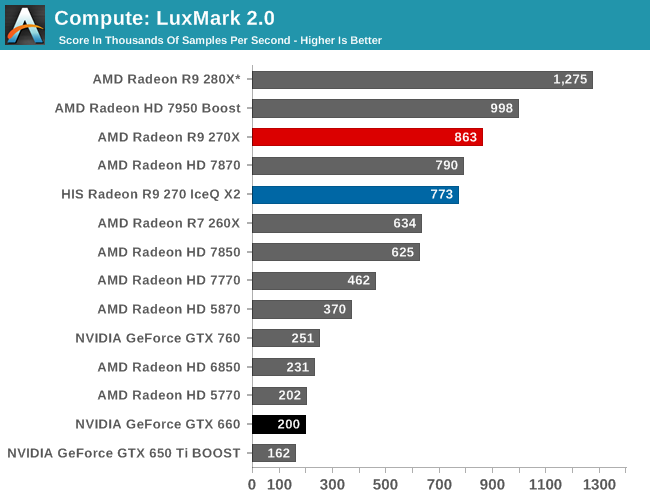
AMD consistently rules the roost on LuxMark, so there aren’t any surprises here. This chart is essentially just the AMD GCN cards sorted by performance, followed by their older VLIW cards and the GeForce cards.
Our 3rd compute benchmark is Sony Vegas Pro 12, an OpenGL and OpenCL video editing and authoring package. Vegas can use GPUs in a few different ways, the primary uses being to accelerate the video effects and compositing process itself, and in the video encoding step. With video encoding being increasingly offloaded to dedicated DSPs these days we’re focusing on the editing and compositing process, rendering to a low CPU overhead format (XDCAM EX). This specific test comes from Sony, and measures how long it takes to render a video.
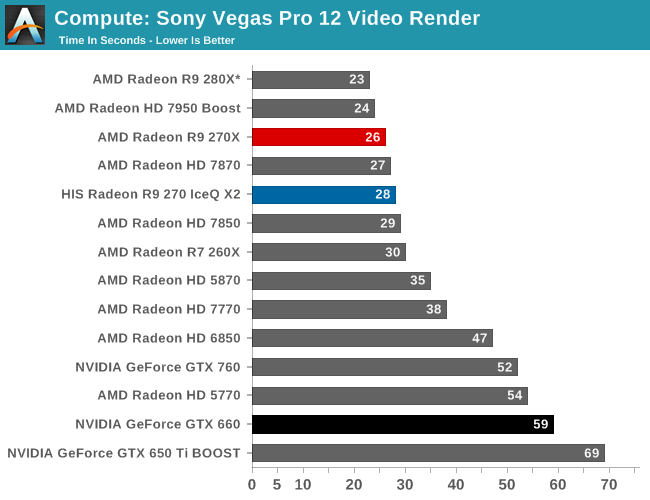
Like LuxMark, Sony Vegas is a benchmark dominated by AMD. The lead here is so great that the 270 could run this benchmark twice over before the GTX 660 completed it once.
Our 4th benchmark set comes from CLBenchmark 1.1. CLBenchmark contains a number of subtests; we’re focusing on the most practical of them, the computer vision test and the fluid simulation test. The former being a useful proxy for computer imaging tasks where systems are required to parse images and identify features (e.g. humans), while fluid simulations are common in professional graphics work and games alike.
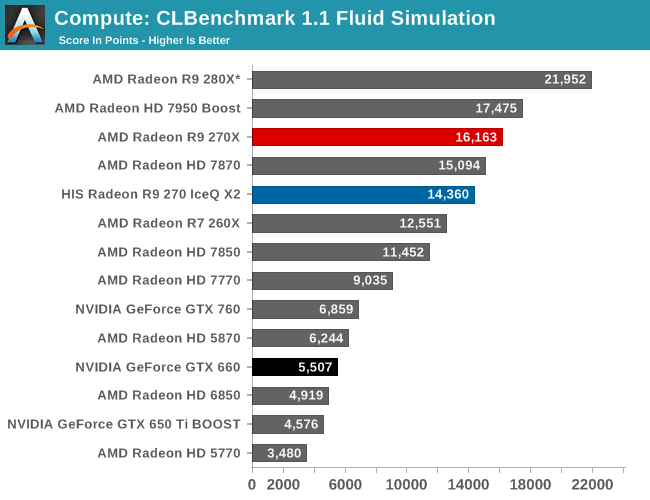
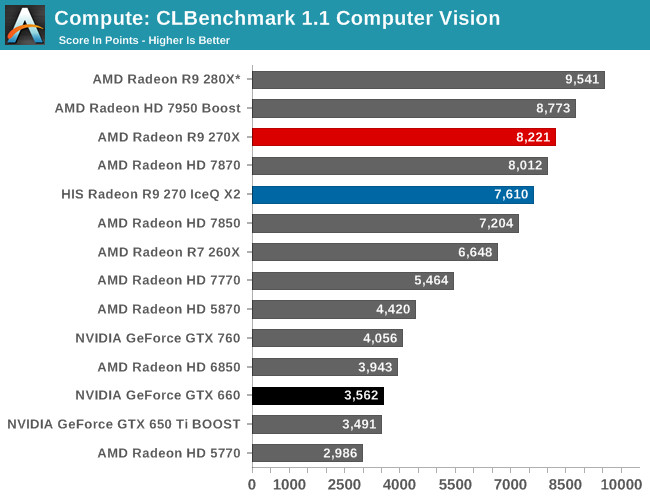
Both CLBenchmark’s fluid simulation benchmark and the computer vision benchmark go to AMD here. The GTX 660 and GTX 760 are not competitive here.
Moving on, our 5th compute benchmark is FAHBench, the official Folding @ Home benchmark. Folding @ Home is the popular Stanford-backed research and distributed computing initiative that has work distributed to millions of volunteer computers over the internet, each of which is responsible for a tiny slice of a protein folding simulation. FAHBench can test both single precision and double precision floating point performance, with single precision being the most useful metric for most consumer cards due to their low double precision performance. Each precision has two modes, explicit and implicit, the difference being whether water atoms are included in the simulation, which adds quite a bit of work and overhead. This is another OpenCL test, as Folding @ Home has moved exclusively to OpenCL this year with FAHCore 17.
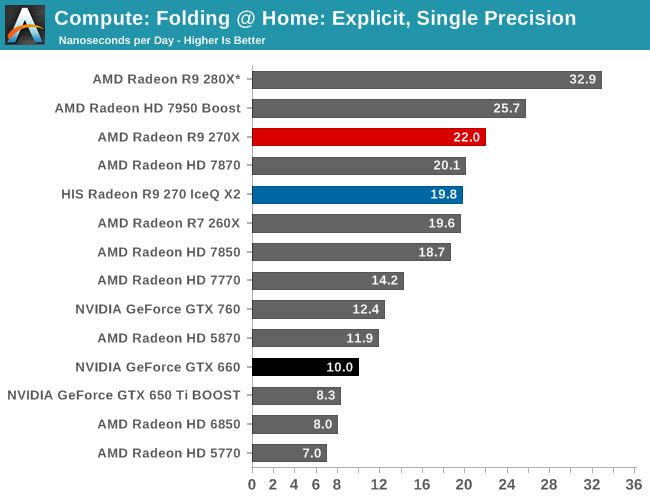
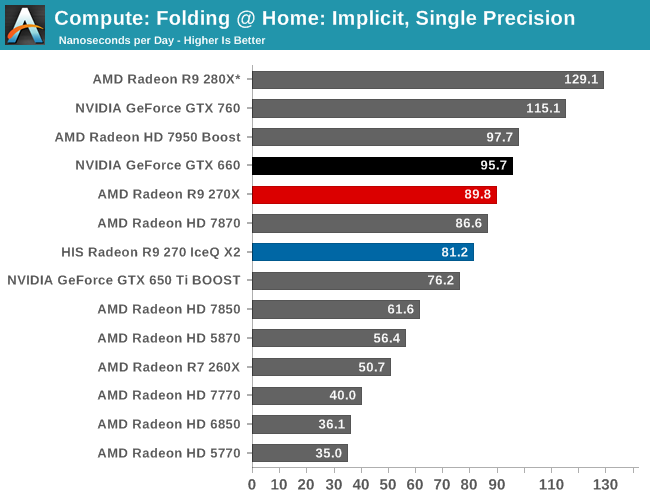
When it comes to Folding@Home, the winner is highly dependent on the specific test. For the explicit simulation the GTX 660 is a significant laggard, leaving the 270 series to take the top spots for sub-$200 cards. In the implicit test however none of the 270 cards can hold their ground against the GTX 660, not even the 270X. Folding@Home uses a mix of these data types so there won’t be any one clear winner, but the 270 series loses by a smaller margin in implicit than the GTX 660 does in explicit.
Wrapping things up, our final compute benchmark is an in-house project developed by our very own Dr. Ian Cutress. SystemCompute is our first C++ AMP benchmark, utilizing Microsoft’s simple C++ extensions to allow the easy use of GPU computing in C++ programs. SystemCompute in turn is a collection of benchmarks for several different fundamental compute algorithms, as described in this previous article, with the final score represented in points. DirectCompute is the compute backend for C++ AMP on Windows, so this forms our other DirectCompute test.
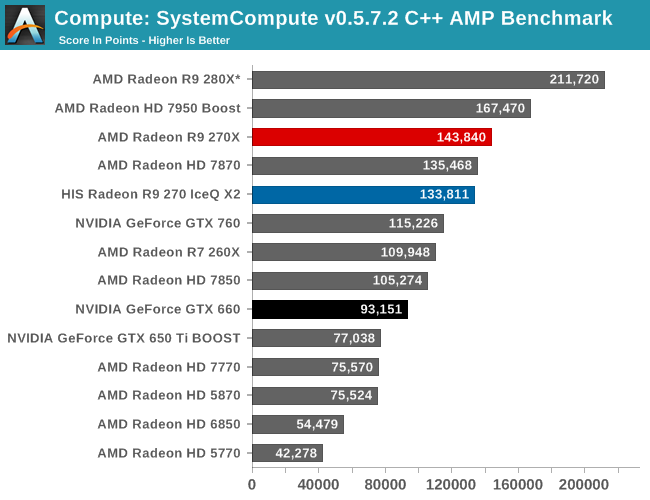
SystemCompute is another compute benchmark that goes to AMD. The 270 and 270X handily beat the GTX 760, never mind the GTX 660.
Originally published at https://www.anandtech.com/show/7503/the-amd-radeon-r9-270x-270-review-feat-asus-his (Wayback Machine).