
The AMD Radeon R9 290 Review
- Posted in
- GPUs
- AMD
- Radeon
- Hawaii
- Radeon 200
Synthetics
As always we’ll also take a quick look at synthetic performance. The 290X shouldn’t pack any great surprises here since it’s still GCN, and as such bound to the same general rules for efficiency, but we do have the additional geometry processors and additional ROPs to occupy our attention.
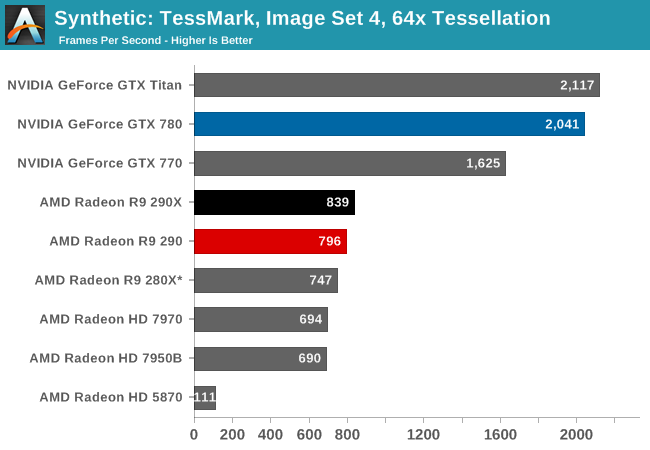
Hawaii performance on TessMark continues to underwhelm. 290 should have plenty of performance to create triangles, but it’s apparently having a problem fully utilizing them, a problem NVIDIA does not have.
Moving on, we have our 3DMark Vantage texture and pixel fillrate tests, which present our cards with massive amounts of texturing and color blending work. These aren’t results we suggest comparing across different vendors, but they’re good for tracking improvements and changes within a single product family.
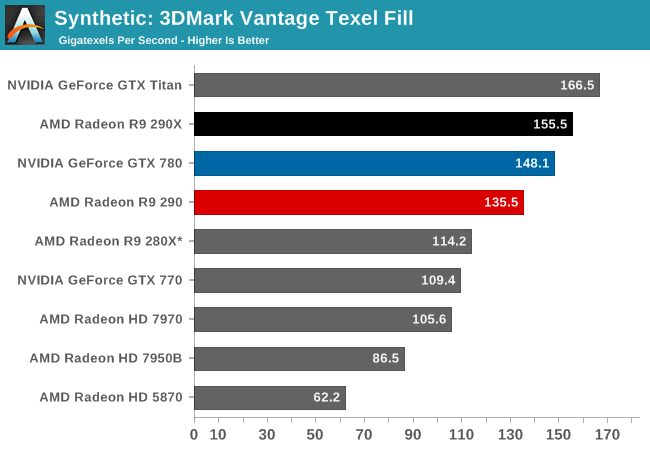
3DMark’s texel fill test is one of a handful of tests where the 290 and 290X are actually separated by as much as the theoretical performance difference implies they should be. Clocked lower and with fewer CUs than 290X, 290 delivers 87% of the texturing performance.
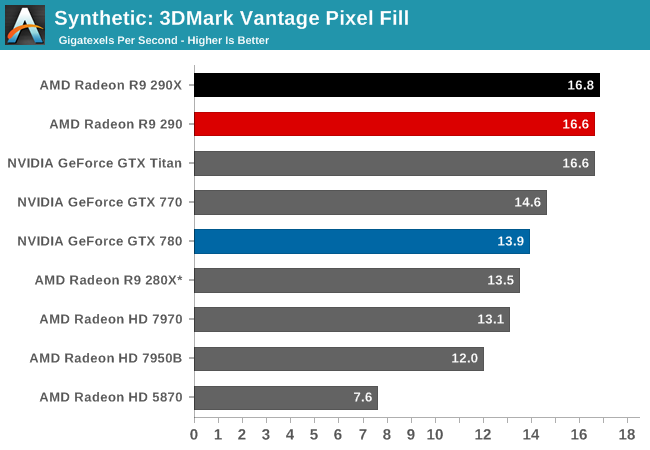
Meanwhile the pixel fill rates show just how close the 290 and 290X can be even under best case circumstances for each card, due to the fact that they have an equal number of ROPs and equal memory bandwidth. Consequently the 290 loses almost nothing for pixel pushing power as compared to its bigger sibling.
Originally published at https://www.anandtech.com/show/7481/the-amd-radeon-r9-290-review (Wayback Machine).