
ASUS MX299Q Monitor Review
Uniformity is measured using 25 points on the screen in CalMAN and compared to the center measurement. Since the important aspect of uniformity is how accurate the screen looks compared to itself, and not the overall error, this provides a far more accurate method of measurement.
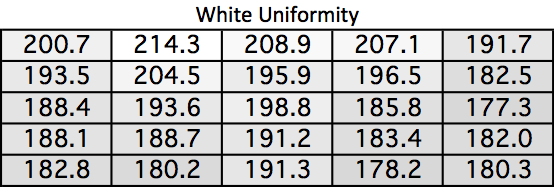
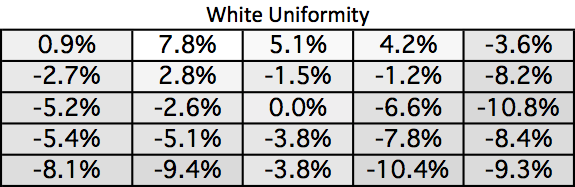
The white uniformity of the MX299Q leaves a bit to be desired. Some areas of the screen have a 10% fall-off in brightness while others rise almost 8% relative to center. This amount of drop-off isn’t easily noticeable but is a bit higher than I would like to see.
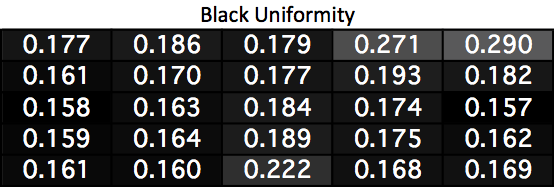
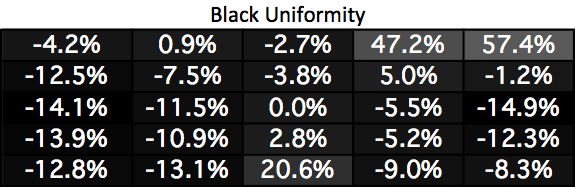
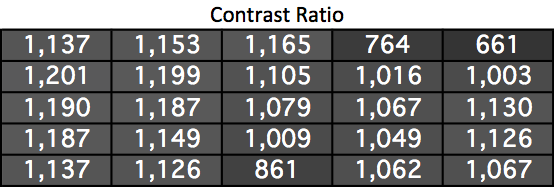
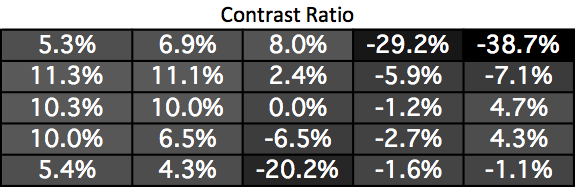
Black uniformity suffers far more than white uniformity. The upper-right corner and lower-center have much brighter readings due to some light leakage at the border. Everywhere else has a lower black reading, which is always better, but those three zones measure poorly compared to every other reading.
Most areas of the screen wind up with a better contrast reading than the center thanks to their lower black levels. The three zones with higher black levels suffer of course, but everywhere else on the screen is between 1,009 and 1,201, providing excellent contrast results overall.
Surprisingly the areas of the screen with light leakage don’t suffer from any dE2000 errors as a result of that. Usually you would see higher errors in those areas but we don’t on the MX299Q. We do see some less-than-ideal numbers on the right side of the display when compared to the left side. The overall average still remains below the target of 3.0 overall, but some of the individual results are certain to fall above 3.0. The center and left side of the screen are excellent overall, but the right side suffers a bit on the MX299Q.
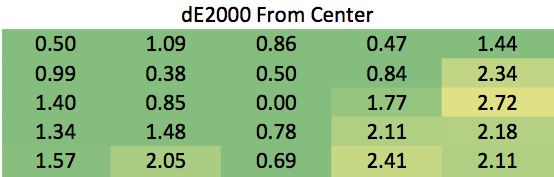
The MX299Q is overall uniform but has a couple areas of concern. The light leakage hurts the contrast ratios and the right side has some color errors as well. Most people will not notice these, but serious designers might.
Originally published at https://www.anandtech.com/show/7288/asus-mx299q-monitor-review (Wayback Machine).