
Samsung SSD 840 EVO Review: 120GB, 250GB, 500GB, 750GB & 1TB Models Tested
- Posted in
- Storage
- SSDs
- Samsung
- TLC
- Samsung SSD 840
Random Read/Write Speed
The four corners of SSD performance are as follows: random read, random write, sequential read and sequential write speed. Random accesses are generally small in size, while sequential accesses tend to be larger and thus we have the four Iometer tests we use in all of our reviews.
Our first test writes 4KB in a completely random pattern over an 8GB space of the drive to simulate the sort of random access that you'd see on an OS drive (even this is more stressful than a normal desktop user would see). I perform three concurrent IOs and run the test for 3 minutes. The results reported are in average MB/s over the entire time. We use both standard pseudo randomly generated data for each write as well as fully random data to show you both the maximum and minimum performance offered by SandForce based drives in these tests. The average performance of SF drives will likely be somewhere in between the two values for each drive you see in the graphs. For an understanding of why this matters, read our original SandForce article.
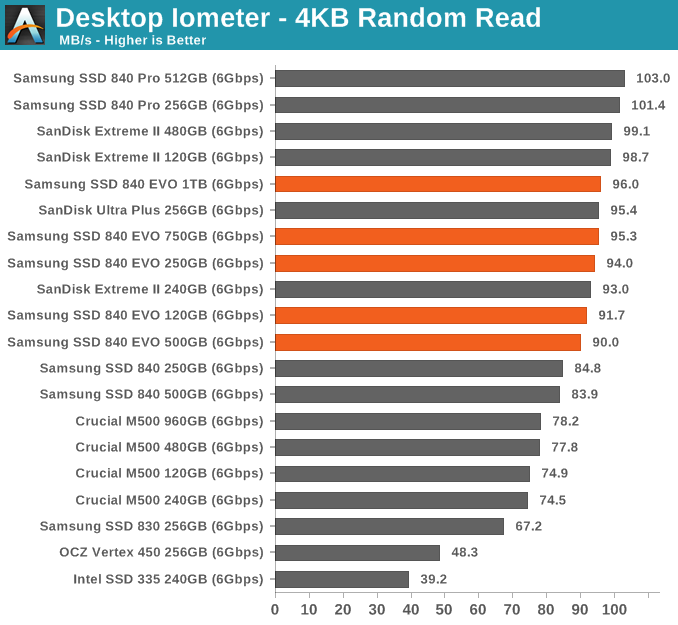
Random read speed is very close to that of the 840 Pro. The EVO doesn't look like a mainstream drive here at all.
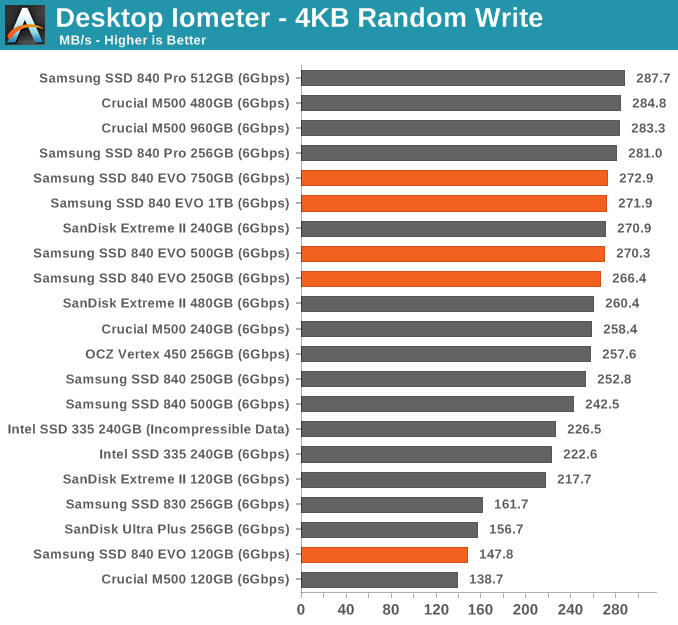
Even peak random write performance is dangerously close to the 840 Pro. Only the 120GB drive shows up behind the pack. I should add that I'll have to redo the way we test 4KB random writes given how optimized current firmwares/architectures have become. The data here is interesting but honestly the performance consistency data from earlier is a better look at what happens to 4KB random write performance over time.
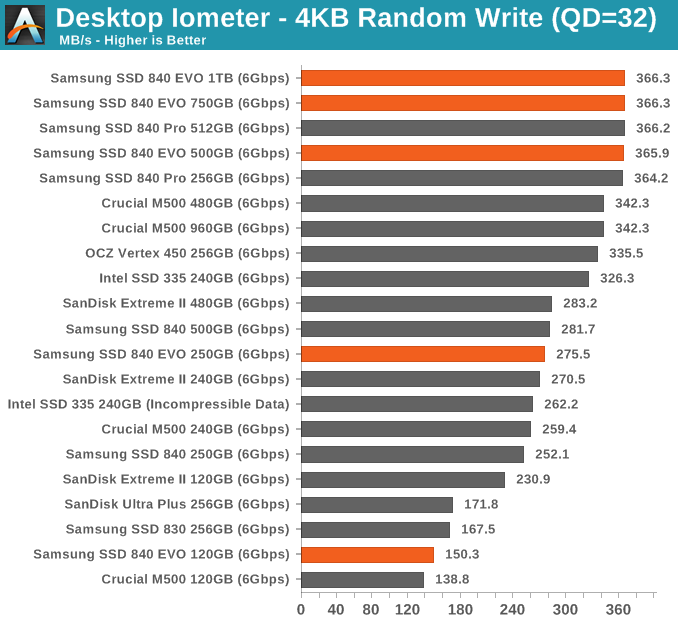
The relatively small difference between QD3 and QD32 random write performance shows you just how good of a job Samsung's controller is doing at write combining. At high queue depths the EVO is just as fast as the 840 Pro here. So much for TLC being slow.
Sequential Read/Write Speed
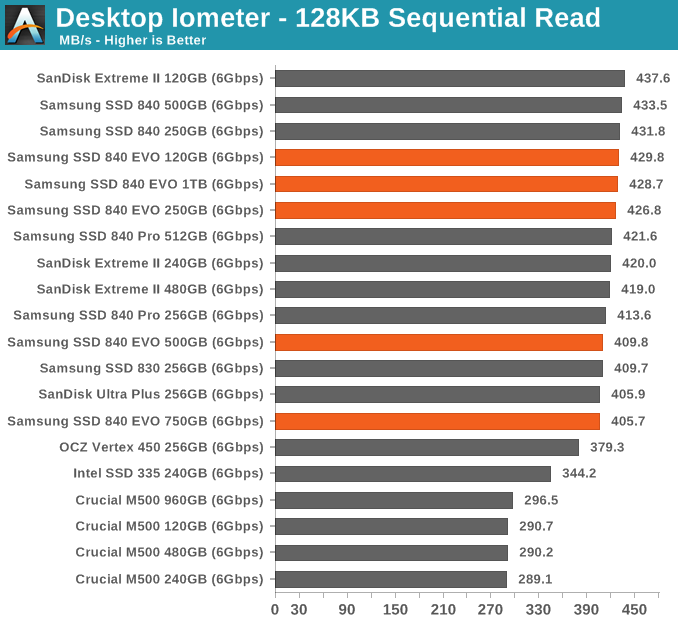
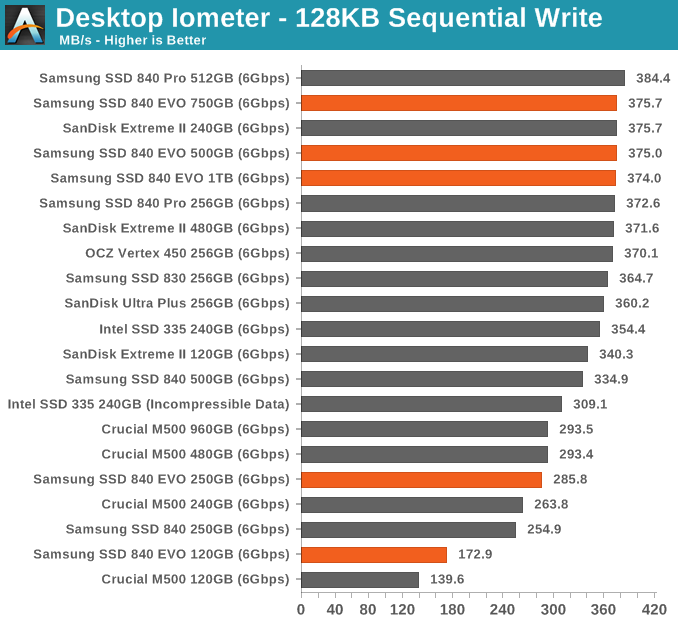
To measure sequential performance I ran a 1 minute long 128KB sequential test over the entire span of the drive at a queue depth of 1. The results reported are in average MB/s over the entire test length.
Sequential read and write performance, even at low queue depths is very good on the EVO. You may notice lower M500 numbers here than elsewhere, the explanation is pretty simple. We run all of our read tests after valid data has been written to the drive. Unfortunately the M500 attempts to aggressively GC data on the drive, so even though we fill the drive and then immediately start reading back the M500 is already working in the background which reduces overall performance here.
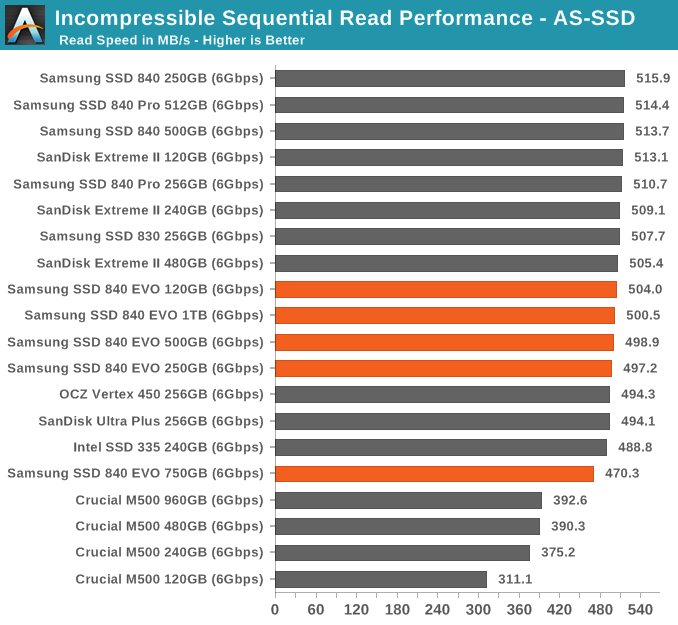
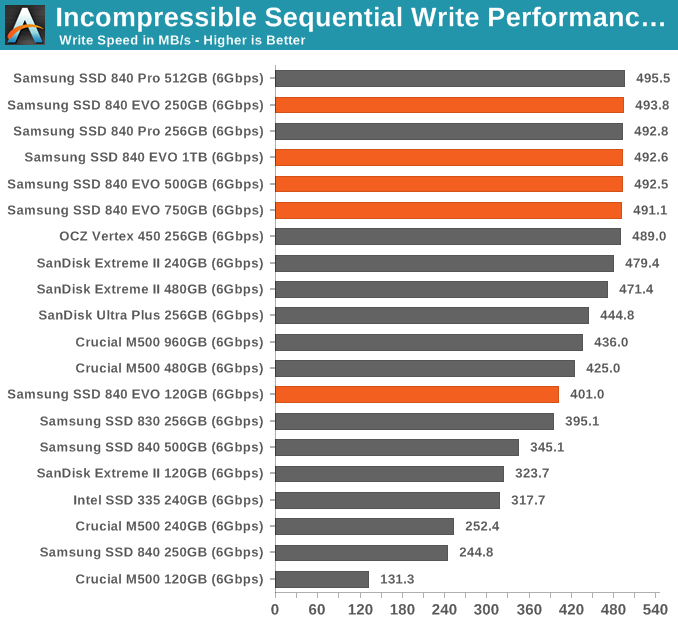
AS-SSD Incompressible Sequential Read/Write Performance
The AS-SSD sequential benchmark uses incompressible data for all of its transfers. The result is a pretty big reduction in sequential write speed on SandForce based controllers.
Originally published at https://www.anandtech.com/show/7173/samsung-ssd-840-evo-review-120gb-250gb-500gb-750gb-1tb-models-tested (Wayback Machine).