
Corsair Neutron & Neutron GTX: All Capacities Tested
Random Read/Write Speed
The four corners of SSD performance are as follows: random read, random write, sequential read and sequential write speed. Random accesses are generally small in size, while sequential accesses tend to be larger and thus we have the four Iometer tests we use in all of our reviews.
Our first test writes 4KB in a completely random pattern over an 8GB space of the drive to simulate the sort of random access that you'd see on an OS drive (even this is more stressful than a normal desktop user would see). I perform three concurrent IOs and run the test for 3 minutes. The results reported are in average MB/s over the entire time. We use both standard pseudo randomly generated data for each write as well as fully random data to show you both the maximum and minimum performance offered by SandForce based drives in these tests. The average performance of SF drives will likely be somewhere in between the two values for each drive you see in the graphs. For an understanding of why this matters, read our original SandForce article.
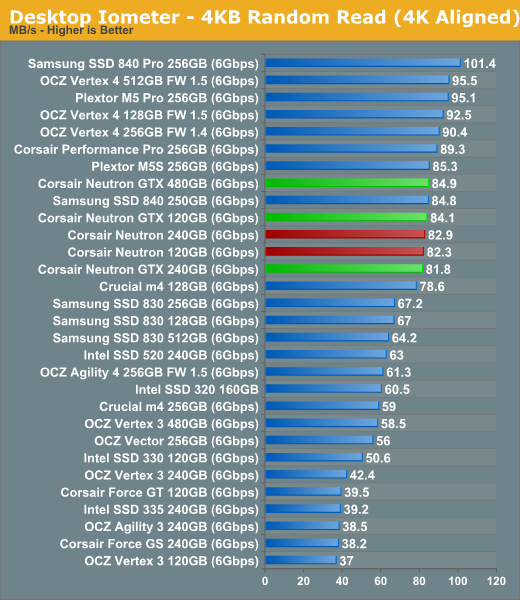
Random read speeds at low queue depths are usually not bound by the NAND because reading from NAND is a lot simpler process than writing, so you get no performance benefit from using faster NAND. There is no performance gain from more NAND die either as all capacities perform nearly equally. The gap between the fastest and slowest of the Neutron drives is 4%, which is hardly worth thinking about.
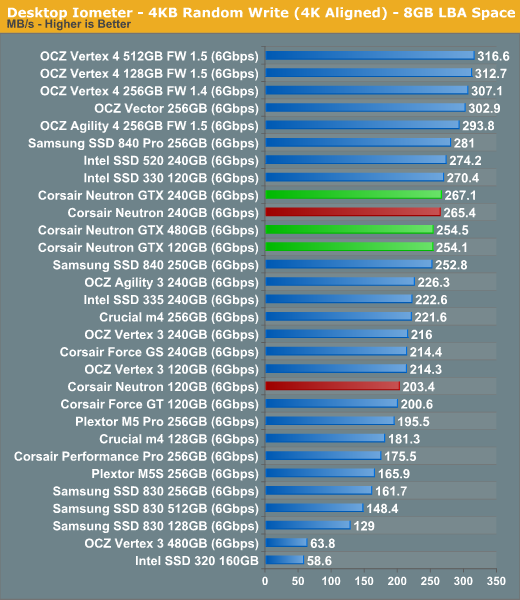
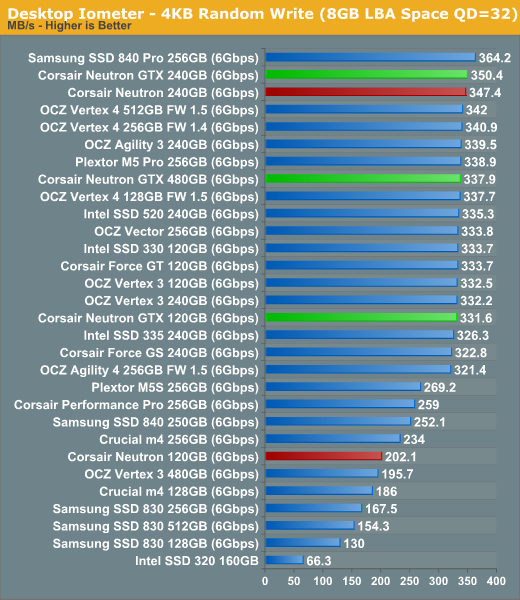
Random write performance is a lot more NAND dependent than random read. The 120GB Neutron simply can't keep up with the other models because it has slower NAND than the 120GB Neutron GTX and fewer die than the 240GB Neutron. The 120GB version of Neutron GTX does surprisingly well and is almost equivalent to its big brothers. While the gap between the higher performance Neutron drives is around 5% in the write tests, the 120GB Neutron is 20% (normal) and 40% (QD=32) behind the 120GB Neutron GTX.
Sequential Read/Write Speed
To measure sequential performance I ran a 1 minute long 128KB sequential test over the entire span of the drive at a queue depth of 1. The results reported are in average MB/s over the entire test length.
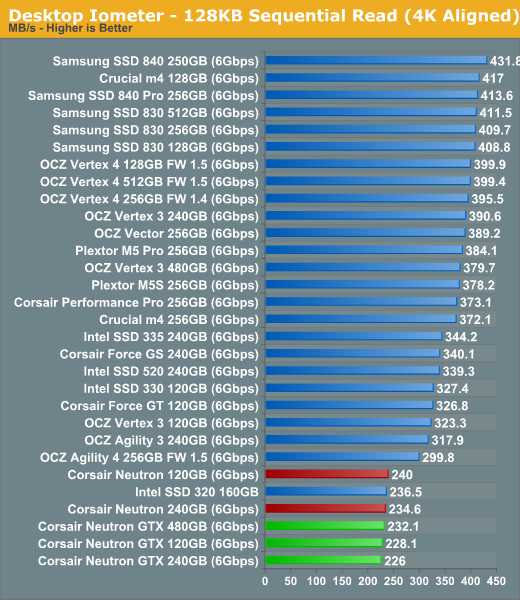
Low queue depth sequential read speed is still an issue but given that Corsair has not provided a new firmware, this was expected. All the drives are running the same M206 firmware, which is what shipping units come with as well. Again, the gap between the fastest and slowest Neutron is around 6% here.
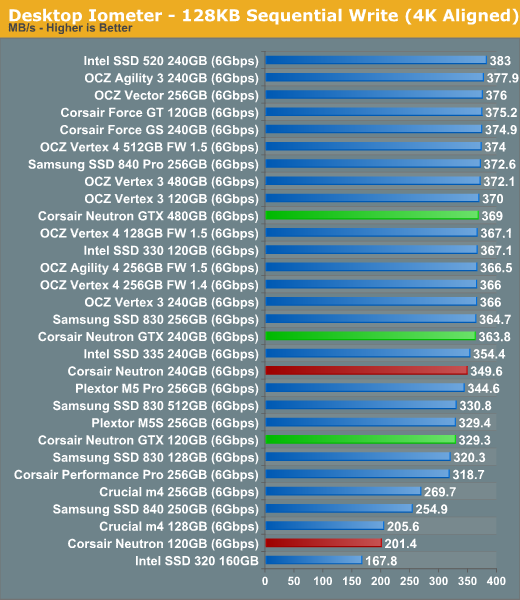
Sequential write speed shares the behavior of random write performance: having more and faster NAND increases throughput though there is essentially no benefit from more than 256GiB of NAND. Both 120GB drives fall behind, though the GTX is still close and performs around 60% faster than the Neutron.
Originally published at https://www.anandtech.com/show/6428/corsair-neutron-neutron-gtx-all-capacities-tested (Wayback Machine).