
Facebook's "Open Compute" Server tested
Measuring Real-world Power Consumption, Part 1
vApus FOS EWL
The Equal Workload (EWL) test is very similar to our previous vApus Mark II "Real-world Power" test. To create a real-world “equal workload” scenario, we throttle the number of users in each VM to a point where you typically get somewhere between 20% and 80% CPU load on a modern dual CPU server. This is the CPU load of vApus FOS:
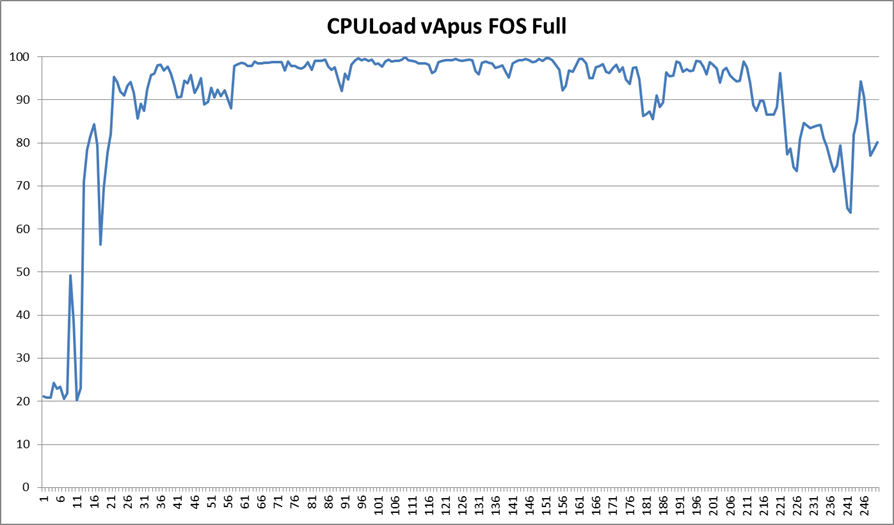
Note that we do not measure performance in the "start up" phase and at the end of test.
Compare this with vApus FOS EWL:

In this case we measure until the very end. The amount of work to be done is always equal, and the faster the system, the sooner it can idle. The time of the test is always the same, and all tested systems will spend some time in idle. The faster the system, the faster the workload will be done and the more time will be spent at idle. For this test we do not measure power but energy (power x time) consumed.
The measured performance cannot be compared as in "system x is z% faster than system y", but it does give you an idea of how well the server handles the load and how quickly it will save energy by entering a low power state.
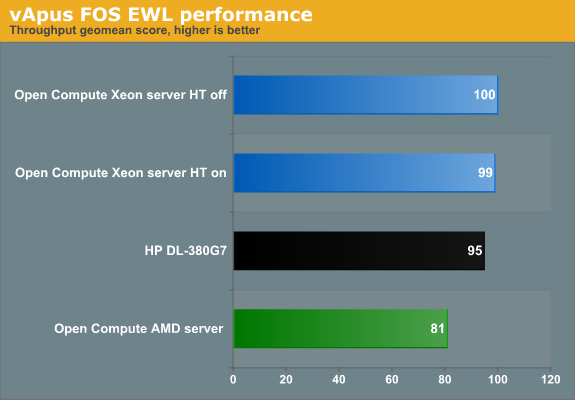
The Xeons are all in the same ballpark. The AMD system with its slower CPUs needs more time to deal with this workload. One interesting thing to note is that Hyper-Threading does not boost throughput. That is not very surprising, considering that the total CPU load is between 20 and 80%. What about response time?
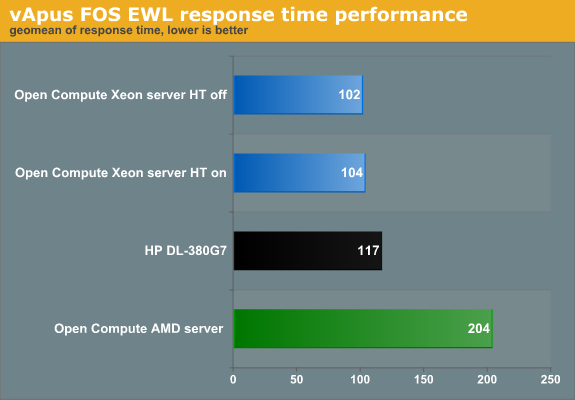
Note that we do not simply take a geomean of the response times. All response times are compared to the reference values. Those percentages (Response time/reference Response time) are then geometrically averaged.
The reference values are measured on the HP DL380 G7 running a native CentOS 5.6 client. We run four tiles of seven vCPUs on top of each server. So the value 117 means that the VMs are on average 17% slower than on the native machine. The 17% higher response times are a result of the fact that when a VM demands two virtual Xeon CPUs, the hypervisor cannot always oblige. It has 24 logical CPUs available, and 28 (7 vCPUs x 4 tiles) are requested. In contrast, the software running on the native machine gets two real cores.
Back to our results. The response time of the AMD based server tells us that even under medium load, a faster CPU can help to reduce the response time, which is the most important performance parameter anyway. However, Hyper-Threading does not help under these circumstances.
Also note that the Open Compute server handles this kind of load slightly better than the HP. So while the Open Compute servers offer a slightly lower top performance, they are at their best in the most realistic benchmark scenarios: between 20% and 80% CPU load. Of course, performance per watt remains the most important metric:
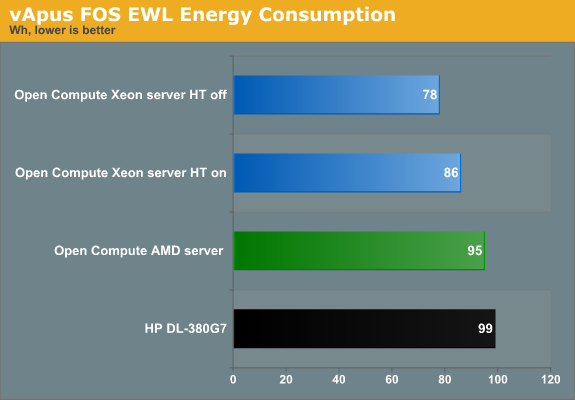
When the CPU load is between 20 and 80%, which is realistic, the HP uses 15% more power. We can reduce the energy consumed by another 10% if we disable Hyper-Threading, which as noted does not improve performance in this scenario anyway.
Originally published at https://www.anandtech.com/show/4958/facebooks-open-compute-server-tested (Wayback Machine).