
Gateway AMD and Intel Laptops, a Platform Analysis
- Posted in
- Laptops
Application Performance - AMD vs. Intel
Next up is an overview of application performance. We've already hinted that Intel wins handily when it comes to general performance, and this should come as no surprise. After all, the Intel juggernaut has been on a rampage ever since the launch of Core 2 Duo back in 2006. (Has it really been that long? Yup.) At the time Core 2 Duo launched, clock for clock (E6600 vs. 4600+ at 2.40GHz) Intel's Core 2 Duo was 10% to 50% faster than AMD's Athlon X2, with the average being somewhere around 20% faster. Three years and a switch to mobile platforms and smaller process technology doesn't radically alter the picture, although updated benchmarks and software that are more multi-core friendly tend to favor Intel even more.
Here's a look at various applications, including 3DMark and PCMark composite scores. We will have a closer look at the PCMark scores on the next page. As for 3DMark, while the CPU scores in the various iterations favor Intel (14% in 3DMark03, 17% in 3DMark05, and 23% in 3DMark06), the overall performance scores give a taste of things to come when we look at graphics performance.
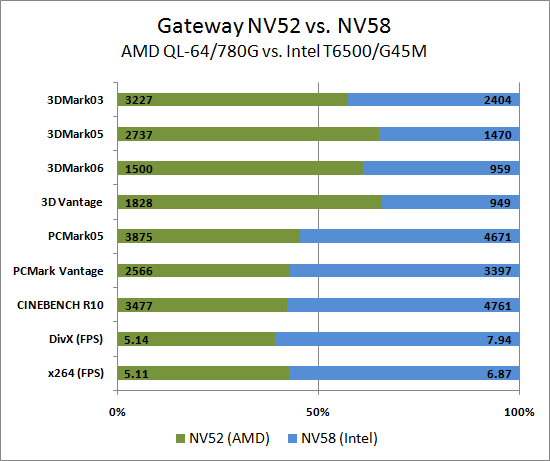
The results aren't very surprising if you've been following the processor and graphics markets for the past couple years. The Intel laptop is clearly faster in applications that depend primarily upon the CPU: 34% faster in x264, 25% faster in DivX, 37% faster in CINEBENCH, 21% faster in PCMark05, and 32% faster in PCMark Vantage. Switch to the graphics intensive 3DMark and the tables turn. The AMD platform is 34% faster in 3DMark03, 86% faster in 3DMark05, 56% faster in 3DMark06, and 93% faster in 3DMark Vantage. Note that we used the "Entry" setting for 3DMark Vantage, and we had to use an external LCD in order to run at the standard resolutions in 3DMark06 and 3DMark Vantage. It's also worth mentioning that the Intel system consistently failed to run 3DMark Vantage at the "Performance" defaults.
The above results are good indication of performance in specific tasks, but PCMark tends to obfuscate the picture by combining many tests into one composite score. Let's have a closer look at the PCMark results, as they can be quite informative.
Update
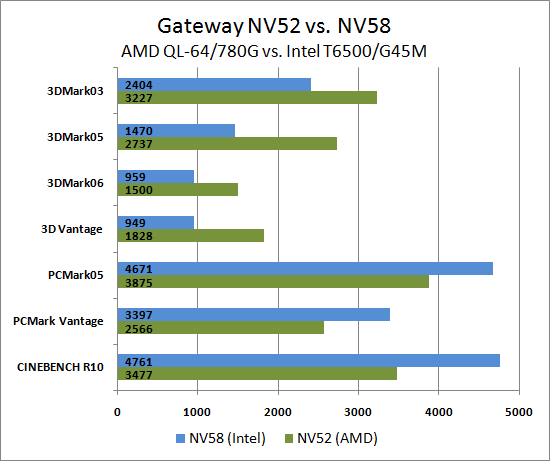
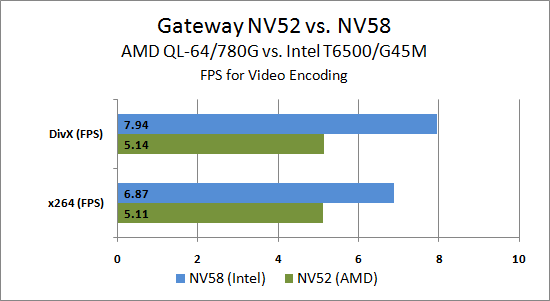
Again, here are alternate graphs showing the same data as the above chart. Note that we had to split out some of the results to make the charts readable (i.e. the low FPS values for video encoding don't work with the other results; that's why we chose the "100% Stacked Bar" chart in the first place).
Originally published at https://www.anandtech.com/show/2818 (Wayback Machine).