
ASRock 4CoreDual-SATA2: Sneak Peek
- Posted in
- Motherboards
General System Performance
The PCMark05 benchmark developed and provided by Futuremark was designed for determining overall system performance for the typical home computing user. This tool provides both system and component level benchmarking results utilizing subsets of real world applications or programs. This benchmark is useful for providing comparative results across a broad array of Graphics, CPU, Hard Disk, and Memory configurations along with multithreading results. In this sense we consider the PCMark benchmark to be both synthetic and real world in nature while providing consistency in our benchmark results.
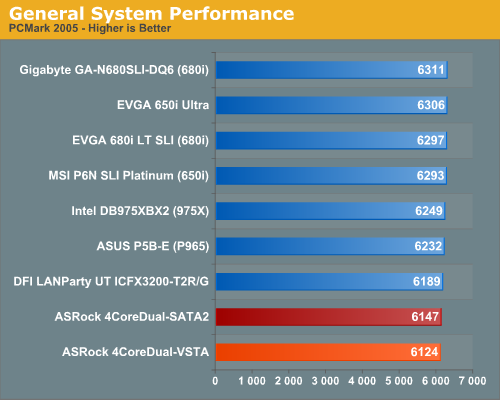
The performance range between the top board and our two ASRock boards is a minimal 3% with the primary difference in scores occurring in the graphics tests where the PCI Express bus is limited to x4 on the ASRock boards. The storage system and multitasking tests are also slightly lower than the Intel and NVIDIA solutions but it would take a benchmark to recognize the differences in actual usage.
We will have IPEAK results in our follow up article but a quick run of the PCMark 2005 HDD test suite had the 4CoreDual-SATA2 scoring 5840 and the 4CoreDual-VSTA reaching 5828, a difference of only 12 points. As far as we are concerned, the differences between Southbridges are minimal except for SATA 3Gb/s operation. Unless you are having compatibility issues with your SATA 3GB/s drives and the 4CoreDual-VSTA board, there is no reason to change boards.
General Application Performance
We devised a script that would compress our standard test folder consisting of 444 files, ten subfolders, and 602MB worth of data, convert a 137MB High Definition QuickTime movie clip to a 37MB MPEG-4 format, play back the first two chapters of Office Space with PowerDVD, and run our AVG anti-virus program in the background. We stop the script when the file compression and video conversion are complete. This is a very taxing script for the CPU, Memory, and Storage subsystem. We also found it to be a good indicator of system stability during testing.
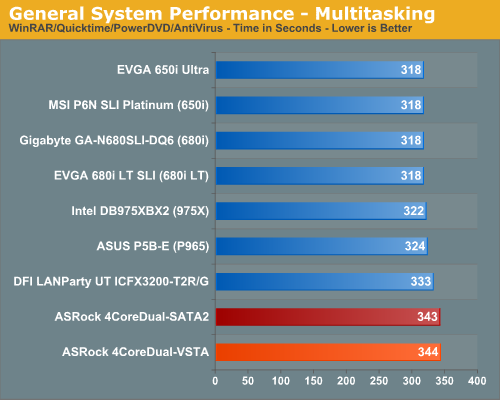
The performance difference basically mirrors our PCMark 2005 tests with the Intel and NVIDIA chipset boards finishing at the top due to great CPU throughput, memory access, and multitasking performance. The main differences between the VIA based boards and the others is in the WinRAR scores where the ASRock boards performed terribly; we will see this more clearly in our standalone WinRAR benchmark. Removing the WinRAR test from this benchmark resulted in the VIA based boards finishing near the top in our video conversion test.
Media Encoding Performance
Our first encoding test is quite easy: we take our original Office Space DVD and use AnyDVD and Nero Recode 2 to copy the full DVD to the hard drive without compression, thus providing an almost exact duplicate of the DVD. We then fire up Nero Recode 2, select our Office Space copy on the hard drive, and perform a shrink operation to allow the entire movie along with extras to fit on a single 4.5GB DVD disc. We leave all options on their defaults except we disable the advanced analysis option. The scores reported include the full encoding process and are represented in seconds, with lower numbers indicating better performance.
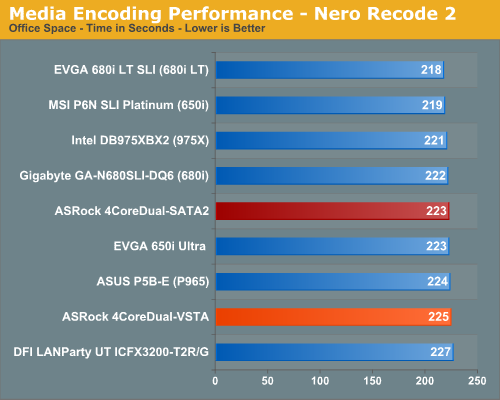
We did not expect a strong finish from the two ASRock boards in this test based upon previous results. The spread between all of the boards is only 4% with our SATA2 board finishing in the middle of the pack. With CPU throughput and disk access times being the critical factors affecting test scores we expected these boards to have scored at the absolute bottom. In this particular test we noticed CPU throughput is slightly hindering the board's performance. We say this because the disk access time and transfer rate for the video files are among the best in our secondary tests measuring disk throughput - something which frankly surprises us.
Audio Encoding Performance
While the VIA chipset boards are competitive in our video encoding test, we wanted to see how they faired on the audio side. Our audio test suite consists of Exact Audio Copy v095.b4 and LAME 3.98a3. We utilize the INXS Greatest Hits CD that contains 16 tracks totaling 606MB of one time '80s hits. We set up EAC for variable bit rate encoding, burst mode for extraction, use external program for compression, and to start the external compressor upon extraction (EAC will read the next track while LAME is working on the previous track, thus removing a potential bottleneck with the optical drive). We also set the number of active threads to two to ensure both cores are active during testing. The results are presented in seconds for the encoding process, with lower numbers being better.
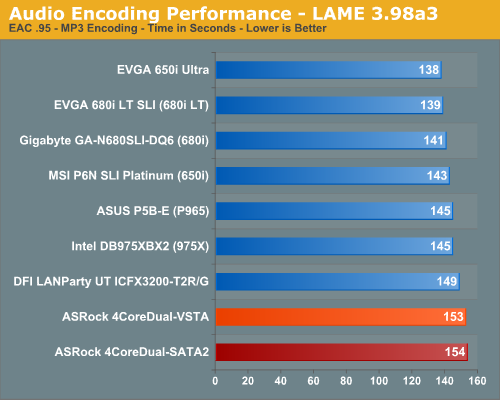
Our Plextor drive consistently takes two minutes and nine seconds to read all sixteen tracks. This means our test systems are only utilizing one core during testing until the midway point of the extraction process where the drive speed begins exceeding the capability of the encoder and requires the use of a second thread.
Unlike the media encoding section we see the ASRock boards scoring about 11% worse than the top boards in a benchmark where CPU and disk throughput are very important. Based on our previous results we would have to say that CPU throughput and memory access speeds negatively affected our two ASRock boards in this benchmark. While the differences are minimal in the overall scheme of things, it was clear during the test when both processor threads became active that the VIA based boards were definitely slower.
The PCMark05 benchmark developed and provided by Futuremark was designed for determining overall system performance for the typical home computing user. This tool provides both system and component level benchmarking results utilizing subsets of real world applications or programs. This benchmark is useful for providing comparative results across a broad array of Graphics, CPU, Hard Disk, and Memory configurations along with multithreading results. In this sense we consider the PCMark benchmark to be both synthetic and real world in nature while providing consistency in our benchmark results.
The performance range between the top board and our two ASRock boards is a minimal 3% with the primary difference in scores occurring in the graphics tests where the PCI Express bus is limited to x4 on the ASRock boards. The storage system and multitasking tests are also slightly lower than the Intel and NVIDIA solutions but it would take a benchmark to recognize the differences in actual usage.
We will have IPEAK results in our follow up article but a quick run of the PCMark 2005 HDD test suite had the 4CoreDual-SATA2 scoring 5840 and the 4CoreDual-VSTA reaching 5828, a difference of only 12 points. As far as we are concerned, the differences between Southbridges are minimal except for SATA 3Gb/s operation. Unless you are having compatibility issues with your SATA 3GB/s drives and the 4CoreDual-VSTA board, there is no reason to change boards.
General Application Performance
We devised a script that would compress our standard test folder consisting of 444 files, ten subfolders, and 602MB worth of data, convert a 137MB High Definition QuickTime movie clip to a 37MB MPEG-4 format, play back the first two chapters of Office Space with PowerDVD, and run our AVG anti-virus program in the background. We stop the script when the file compression and video conversion are complete. This is a very taxing script for the CPU, Memory, and Storage subsystem. We also found it to be a good indicator of system stability during testing.
The performance difference basically mirrors our PCMark 2005 tests with the Intel and NVIDIA chipset boards finishing at the top due to great CPU throughput, memory access, and multitasking performance. The main differences between the VIA based boards and the others is in the WinRAR scores where the ASRock boards performed terribly; we will see this more clearly in our standalone WinRAR benchmark. Removing the WinRAR test from this benchmark resulted in the VIA based boards finishing near the top in our video conversion test.
Media Encoding Performance
Our first encoding test is quite easy: we take our original Office Space DVD and use AnyDVD and Nero Recode 2 to copy the full DVD to the hard drive without compression, thus providing an almost exact duplicate of the DVD. We then fire up Nero Recode 2, select our Office Space copy on the hard drive, and perform a shrink operation to allow the entire movie along with extras to fit on a single 4.5GB DVD disc. We leave all options on their defaults except we disable the advanced analysis option. The scores reported include the full encoding process and are represented in seconds, with lower numbers indicating better performance.
We did not expect a strong finish from the two ASRock boards in this test based upon previous results. The spread between all of the boards is only 4% with our SATA2 board finishing in the middle of the pack. With CPU throughput and disk access times being the critical factors affecting test scores we expected these boards to have scored at the absolute bottom. In this particular test we noticed CPU throughput is slightly hindering the board's performance. We say this because the disk access time and transfer rate for the video files are among the best in our secondary tests measuring disk throughput - something which frankly surprises us.
Audio Encoding Performance
While the VIA chipset boards are competitive in our video encoding test, we wanted to see how they faired on the audio side. Our audio test suite consists of Exact Audio Copy v095.b4 and LAME 3.98a3. We utilize the INXS Greatest Hits CD that contains 16 tracks totaling 606MB of one time '80s hits. We set up EAC for variable bit rate encoding, burst mode for extraction, use external program for compression, and to start the external compressor upon extraction (EAC will read the next track while LAME is working on the previous track, thus removing a potential bottleneck with the optical drive). We also set the number of active threads to two to ensure both cores are active during testing. The results are presented in seconds for the encoding process, with lower numbers being better.
Our Plextor drive consistently takes two minutes and nine seconds to read all sixteen tracks. This means our test systems are only utilizing one core during testing until the midway point of the extraction process where the drive speed begins exceeding the capability of the encoder and requires the use of a second thread.
Unlike the media encoding section we see the ASRock boards scoring about 11% worse than the top boards in a benchmark where CPU and disk throughput are very important. Based on our previous results we would have to say that CPU throughput and memory access speeds negatively affected our two ASRock boards in this benchmark. While the differences are minimal in the overall scheme of things, it was clear during the test when both processor threads became active that the VIA based boards were definitely slower.
Originally published at https://www.anandtech.com/show/2262 (Wayback Machine).