
Supermicro's Twin: Two nodes and 16 cores in 1U
- Posted in
- IT Computing
Network Load Balancing
It is pretty clear that we can not test the Supermicro 1U Twin in a conventional manner. Testing one node alone doesn't make sense: who care if it is 1-2% faster or slower than a typical Intel 5000p chipset based server? So we decided to use Windows 2003 Network Load Balancing or software load balancing. NLB is used mostly for splitting the load of heavy web-based traffic over several servers to improve response times, throughput and more importantly, availability. Each node sends a heartbeat signal. If a host fails and stops emitting heartbeats, the other nodes will remove it from their NLB cluster information, and although a few seconds of network traffic will be lost, the website remains available. What is even better is the fact that NLB, due to the relatively simple distributed filtering algorithm on each node, puts very little load on the CPUs of the node. The heartbeat messages also consume very little bandwidth. Testing with a fast Ethernet switch instead of our usual Gigabit Ethernet switch didn't result in any significant performance loss, whether we talk about response time (ms) or throughput (URLs served per second).
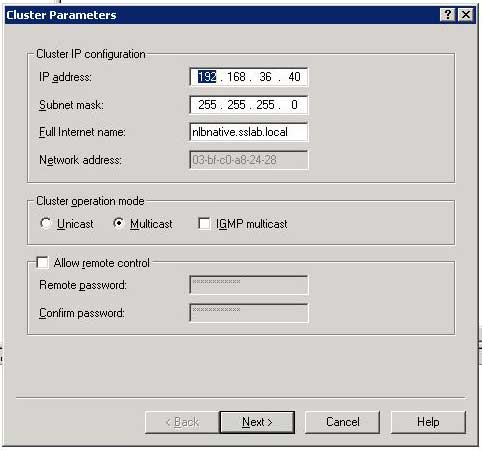
With four and up to eight CPUs per node, it takes a while before the NLB cluster becomes fully loaded, as you can see at the picture below.

Web server measurements are a little harder to interpret than other tests, as you always have two measurements: response time and throughput. Theoretically, you could set a "still acceptable" maximum response time and measure how many requests the system can respond to without breaking this limit. However, in reality it is almost impossible to test this way, as we simulate a number of simultaneous users which send requests and then measure both response time and throughput. Each simultaneous user takes about one second to send a new request. Notice that the number of simultaneous user is not equal to the total number of users. One hundred simultaneous users may well mean that there are 20 users constantly clicking to get new information while 240 others are clicking and typing every 3 seconds.
Another problem is of course that in reality you never want your web server to be at 100% CPU load. For our academic research, we track tens of different parameters, including CPU load. For a report such as this one, this would mean however that you have to wade through massive tables to get an idea how the different systems compare. Therefore, we decide to pick out a request rate at which all systems where maxed out, to give an idea of the maximum throughput and the associated latency. In the graphics below, 200 simultaneous users torture the MCS web application requesting one URL every second.
The single node tests are represented by the lightly colored graphs, the darker graphs represent our measurement in NLB mode (2 nodes). We were only able to get four Xeon E5320 (quad core 1.86 GHz Intel Core architecture) processors for this article, unfortunately; it would have been nice to test with various other CPUs in 4-way configurations, but sometimes you have to take what you can get.
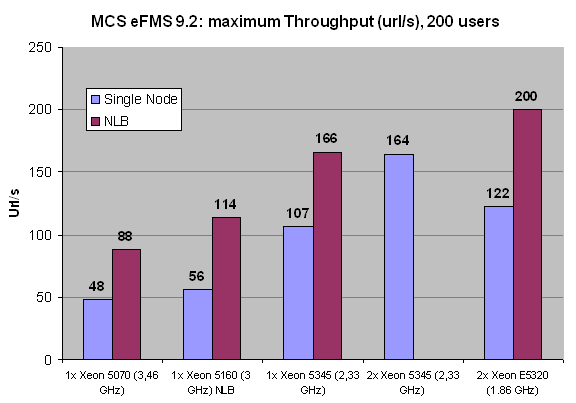
Notice that two CPUs connected by NLB and thus Gigabit Ethernet are not slower than two CPUs connected by the FSB. In other words, two nodes with one CPU per node are not slower than two CPUs in a single node. The most likely explanation is that the overhead of communicating over a TCP/IP Ethernet connection is offset by the higher amount of bandwidth that each CPU in the node has available. From the numbers above we may conclude that NLB scales very well: adding a second node increases the throughput by 60 to 100%. Scaling decreases as we increase the CPU power and the number of cores which is no surprise, as the latency of the Gigabit connection between the nodes starts to become more important. To obtain better scaling, we would probably have to use an InfiniBand connection but for this type of application that seems a bit like overkill.
Also note that 200 users means 200 simultaneous users which may translate - depending on the usage model of the client - to a few thousands of real active users in a day. The only configuration that can sustain this is the NLB configuration: in reality it could serve about 225 simultaneous users at one URL/s, but as we only asked for 200, it served up 200.
To understand this better, let us see what the corresponding response time is. Remember that this is not the typical response time of the application, but the response you get from an overloaded server. Only the 16 Xeon E5320 cores were capable of delivering more than 200 URL/s (about 225), while the other configurations had to work with a backlog.
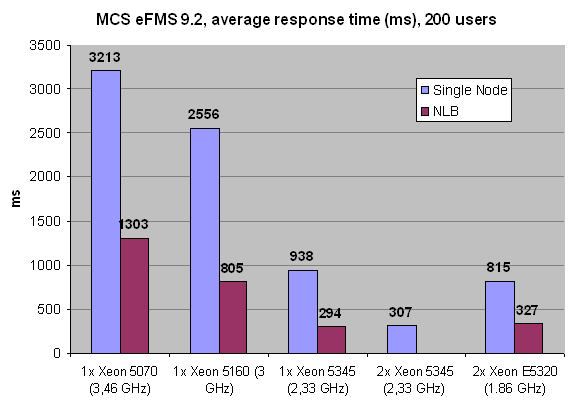
It is a bit extreme, but it gives a very good idea of what happens if you overload a server: response times increase almost exponentially. When we tested with 100 users, our dual Xeon E5320 (1.86 GHz, four cores in one node) provided a response time of about 120 ms on average per URL - measured across about 40 different URLs - and so did the same configuration in NLB (two nodes). A Xeon 5160 in each node in NLB responded in 145 ms, as the demanded throughput was much closer to its maximum of 114 ms. Now take a look at the measured response times at 200 URL/s.
The Xeon Dempsey 5070 (dual core 3.46 GHz 2MB NetBurst architecture) is only capable of sustaining half the user requests we demand from it, and the result is a 10X higher response time than our two node 16 core NLB server, or almost 30X higher than the minimum response time. Our quad Xeon 1.86 in NLB was capable of a response time of 327 ms, almost 3X higher than the lowest measured response time at 100 URL/s. So we conclude that pushing a web server to 90% of its maximum will result in a ~3X higher response time. This clearly shows that you should size your web server to work at about 60%, and no peak should go beyond 90%. Overload your web server with twice the traffic it can handle, and you'll be "rewarded" with response times that get 30X higher than the minimum necessary response time.
It is pretty clear that we can not test the Supermicro 1U Twin in a conventional manner. Testing one node alone doesn't make sense: who care if it is 1-2% faster or slower than a typical Intel 5000p chipset based server? So we decided to use Windows 2003 Network Load Balancing or software load balancing. NLB is used mostly for splitting the load of heavy web-based traffic over several servers to improve response times, throughput and more importantly, availability. Each node sends a heartbeat signal. If a host fails and stops emitting heartbeats, the other nodes will remove it from their NLB cluster information, and although a few seconds of network traffic will be lost, the website remains available. What is even better is the fact that NLB, due to the relatively simple distributed filtering algorithm on each node, puts very little load on the CPUs of the node. The heartbeat messages also consume very little bandwidth. Testing with a fast Ethernet switch instead of our usual Gigabit Ethernet switch didn't result in any significant performance loss, whether we talk about response time (ms) or throughput (URLs served per second).
With four and up to eight CPUs per node, it takes a while before the NLB cluster becomes fully loaded, as you can see at the picture below.
Web server measurements are a little harder to interpret than other tests, as you always have two measurements: response time and throughput. Theoretically, you could set a "still acceptable" maximum response time and measure how many requests the system can respond to without breaking this limit. However, in reality it is almost impossible to test this way, as we simulate a number of simultaneous users which send requests and then measure both response time and throughput. Each simultaneous user takes about one second to send a new request. Notice that the number of simultaneous user is not equal to the total number of users. One hundred simultaneous users may well mean that there are 20 users constantly clicking to get new information while 240 others are clicking and typing every 3 seconds.
Another problem is of course that in reality you never want your web server to be at 100% CPU load. For our academic research, we track tens of different parameters, including CPU load. For a report such as this one, this would mean however that you have to wade through massive tables to get an idea how the different systems compare. Therefore, we decide to pick out a request rate at which all systems where maxed out, to give an idea of the maximum throughput and the associated latency. In the graphics below, 200 simultaneous users torture the MCS web application requesting one URL every second.
The single node tests are represented by the lightly colored graphs, the darker graphs represent our measurement in NLB mode (2 nodes). We were only able to get four Xeon E5320 (quad core 1.86 GHz Intel Core architecture) processors for this article, unfortunately; it would have been nice to test with various other CPUs in 4-way configurations, but sometimes you have to take what you can get.
Notice that two CPUs connected by NLB and thus Gigabit Ethernet are not slower than two CPUs connected by the FSB. In other words, two nodes with one CPU per node are not slower than two CPUs in a single node. The most likely explanation is that the overhead of communicating over a TCP/IP Ethernet connection is offset by the higher amount of bandwidth that each CPU in the node has available. From the numbers above we may conclude that NLB scales very well: adding a second node increases the throughput by 60 to 100%. Scaling decreases as we increase the CPU power and the number of cores which is no surprise, as the latency of the Gigabit connection between the nodes starts to become more important. To obtain better scaling, we would probably have to use an InfiniBand connection but for this type of application that seems a bit like overkill.
Also note that 200 users means 200 simultaneous users which may translate - depending on the usage model of the client - to a few thousands of real active users in a day. The only configuration that can sustain this is the NLB configuration: in reality it could serve about 225 simultaneous users at one URL/s, but as we only asked for 200, it served up 200.
To understand this better, let us see what the corresponding response time is. Remember that this is not the typical response time of the application, but the response you get from an overloaded server. Only the 16 Xeon E5320 cores were capable of delivering more than 200 URL/s (about 225), while the other configurations had to work with a backlog.
It is a bit extreme, but it gives a very good idea of what happens if you overload a server: response times increase almost exponentially. When we tested with 100 users, our dual Xeon E5320 (1.86 GHz, four cores in one node) provided a response time of about 120 ms on average per URL - measured across about 40 different URLs - and so did the same configuration in NLB (two nodes). A Xeon 5160 in each node in NLB responded in 145 ms, as the demanded throughput was much closer to its maximum of 114 ms. Now take a look at the measured response times at 200 URL/s.
The Xeon Dempsey 5070 (dual core 3.46 GHz 2MB NetBurst architecture) is only capable of sustaining half the user requests we demand from it, and the result is a 10X higher response time than our two node 16 core NLB server, or almost 30X higher than the minimum response time. Our quad Xeon 1.86 in NLB was capable of a response time of 327 ms, almost 3X higher than the lowest measured response time at 100 URL/s. So we conclude that pushing a web server to 90% of its maximum will result in a ~3X higher response time. This clearly shows that you should size your web server to work at about 60%, and no peak should go beyond 90%. Overload your web server with twice the traffic it can handle, and you'll be "rewarded" with response times that get 30X higher than the minimum necessary response time.
Originally published at https://www.anandtech.com/show/2240 (Wayback Machine).