
nForce 500: nForce4 on Steroids?
- Posted in
- CPUs
Synthetic Graphics Performance
The 3DMark series of benchmarks developed and provided by Futuremark are among the most widely used tools for benchmark reporting and comparisons. Although the benchmarks are very useful for providing apples-to-apples comparisons across a broad array of GPU and CPU configurations, they are not a substitute for actual application and gaming benchmarks. In this sense we consider the 3DMark benchmarks to be purely synthetic in nature but still valuable for providing consistent measurements of performance.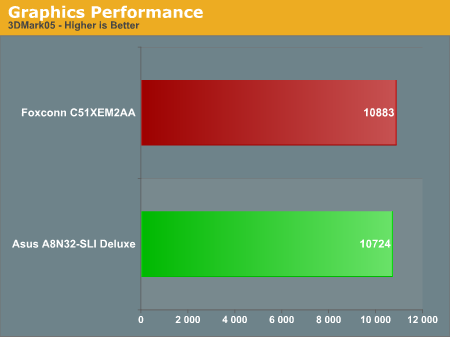
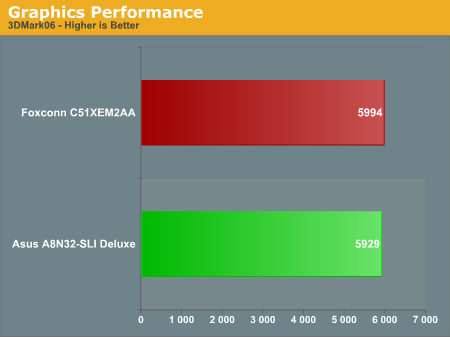
Our nForce 590 SLI system improves upon the performance of the nForce4 system by an average of 1%. These test results are basically a tie and indicates both platforms are performing equally with the same video card.
General System Performance
The PCMark05 benchmark developed and provided by Futuremark was designed for determining overall system performance for the typical home computing user. This tool provides both system and component level benchmarking results utilizing subsets of real world applications or programs. This benchmark is useful for providing comparative results across a broad array of Graphics subsystems, CPU, Hard Disk, and Memory configurations along with multithreading results. In this sense we consider the PCMark benchmark to be both synthetic and real world in nature while providing consistency in our benchmark results.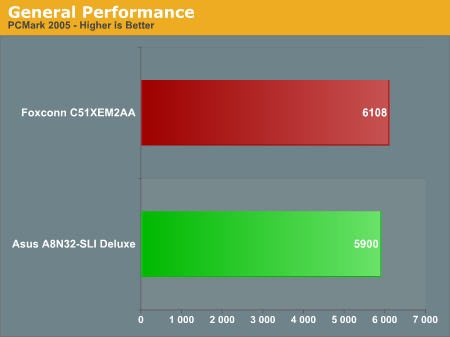
The margins are little wider at 4% in the PCMark05 results, but the margin of error in PCMark05 is also slightly larger. It is obvious from our test results so far that either platform provides excellent results. If you have a socket 939 platform and are happy with its feature set then we do not see a reason to upgrade at this time.
Rendering Performance
We have added the Cinebench 9.5 and POV-RAY 3.6 benchmarks as they heavily stress the CPU subsystem while performing graphics modeling and rendering. We utilize the standard benchmark demos in each program along with the default settings. Cinebench 9.5 features two different benchmarks with one test utilizing a single core and the second test showcasing the power of multiple cores in rendering the benchmark image.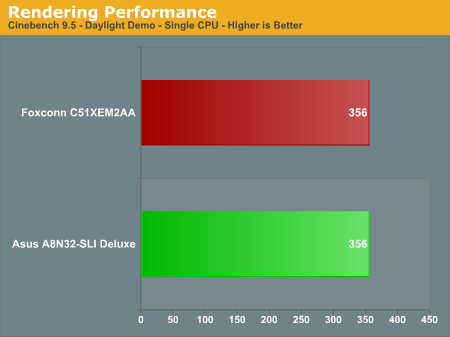
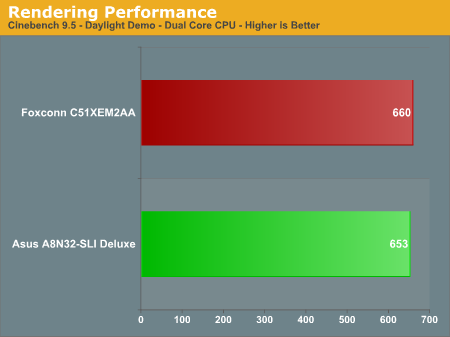
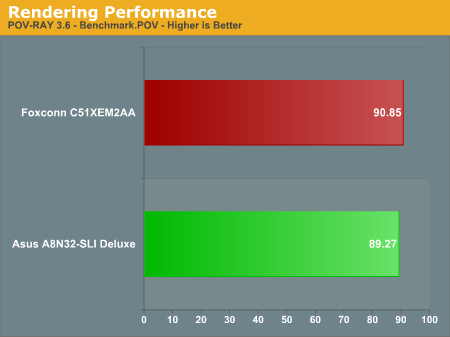
The nForce 500 desktop platform shows small and almost imperceptible differences in these benchmarks, with the 590 AM2 performing slightly better in the demanding POV-RAY benchmark. Once again both platforms are performing equally.
Originally published at https://www.anandtech.com/show/2014 (Wayback Machine).