
Exclusive: SLI Head-to-Head: Monarch Micro-ATX vs. Shuttle SFF
- Posted in
- Systems
Synthetic Gaming Performance
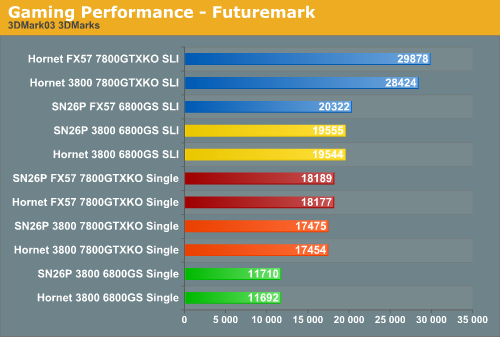
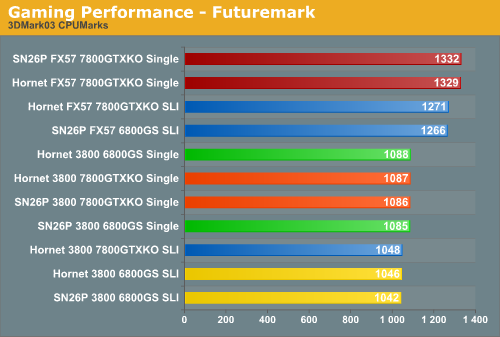
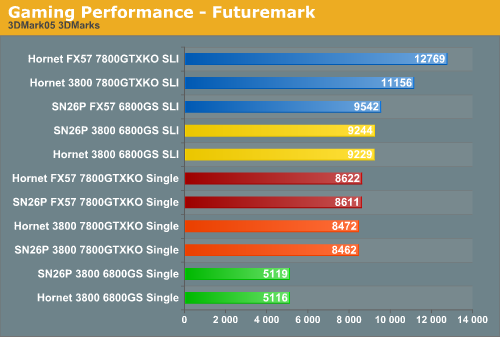
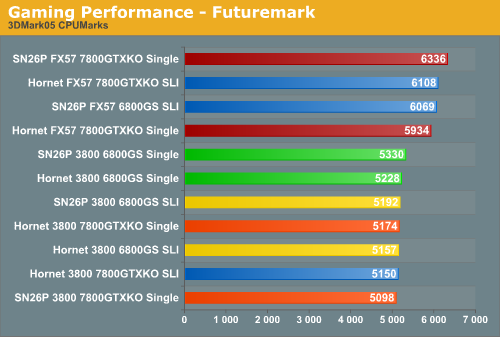
Futuremark's 3DMark applications are very well-known, but at best, they really just represent performance from one more potential gaming engine. We wouldn't give them any more weight than the results from a single game, though the CPU scores are actually a pretty good indication of processor performance.
Futuremark's 3DMark applications are very well-known, but at best, they really just represent performance from one more potential gaming engine. We wouldn't give them any more weight than the results from a single game, though the CPU scores are actually a pretty good indication of processor performance.
 /p>
 /p>
Originally published at https://www.anandtech.com/show/1958 (Wayback Machine).