
HP DX5150 – OEM plus AMD
- Posted in
- Systems
Synthetic Benchmarks
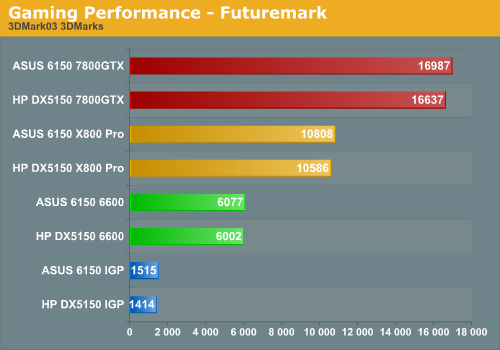
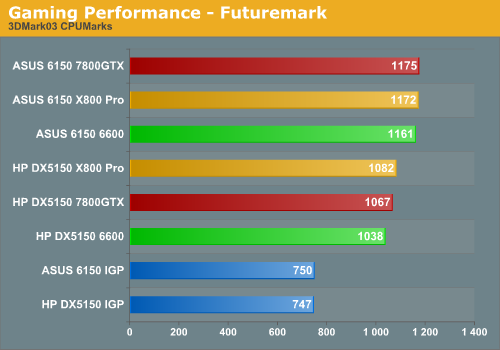
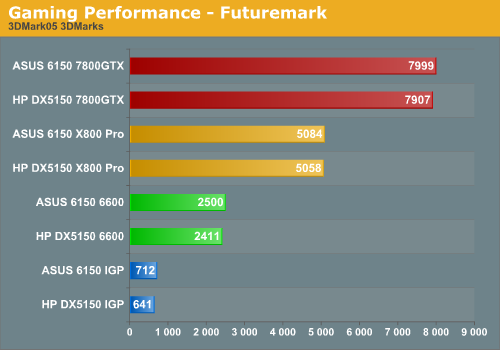
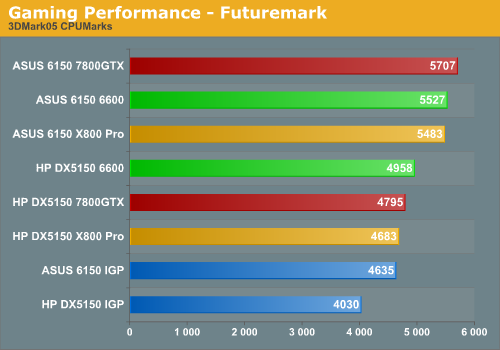
We'll wrap up our performance benchmarking with a couple of less important metrics. Futuremark has been making 3DMark for over six years, and many people refer to it to see how a system will perform in games. We have always preferred real world gaming benchmarks, though it's difficult to come up with repeatable tests for certain genres. We also included the memory latency, as measured by CPU-Z.
Going along with that last point, take a look at the memory latencies. Since both chips are running at 2.4 GHz, we can directly compare the results without converting to nanoseconds. The HP system with its CL3 RAM ends up having 28% higher latencies, which explains why it consistently gets beat by the ASUS system with the slightly slower processor. Also somewhat interesting is that the IGP solutions both have higher memory latencies, showing that the shared memory architecture does have an impact on performance.
We'll wrap up our performance benchmarking with a couple of less important metrics. Futuremark has been making 3DMark for over six years, and many people refer to it to see how a system will perform in games. We have always preferred real world gaming benchmarks, though it's difficult to come up with repeatable tests for certain genres. We also included the memory latency, as measured by CPU-Z.
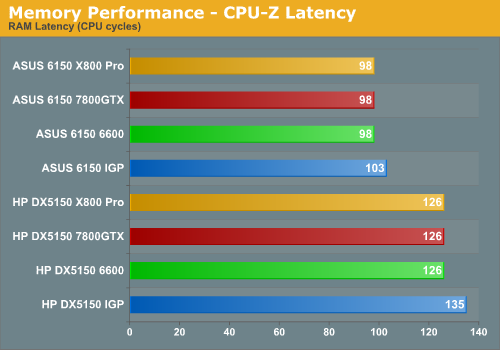
Going along with that last point, take a look at the memory latencies. Since both chips are running at 2.4 GHz, we can directly compare the results without converting to nanoseconds. The HP system with its CL3 RAM ends up having 28% higher latencies, which explains why it consistently gets beat by the ASUS system with the slightly slower processor. Also somewhat interesting is that the IGP solutions both have higher memory latencies, showing that the shared memory architecture does have an impact on performance.
Originally published at https://www.anandtech.com/show/1895 (Wayback Machine).