
Intel NUC 13 Pro Arena Canyon Review: Raptor Lake Brings Incremental Gains
Power Consumption and Thermal Characteristics
The power consumption at the wall was measured with a 4K display being driven through the HDMI port of the system. In the graph below, we compare the idle and load power of the Intel NUC13ANKi7 (Arena Canyon) with other systems evaluated before. For load power consumption, we ran the AIDA64 System Stability Test with various stress components, as well as our custom stress test with Prime95 / Furmark, and noted the peak as well as idling power consumption at the wall.
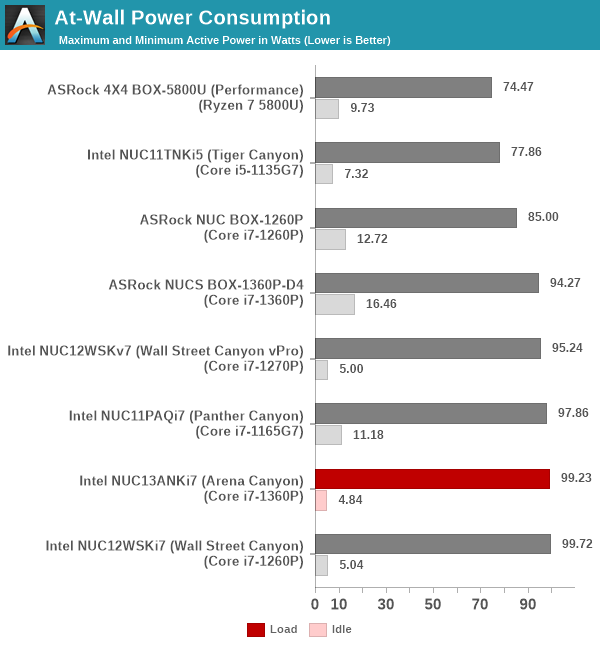
The numbers are consistent with the TDP and suggested PL1 / PL2 values for the processors in the systems, and do not come as any surprise. The load number is affected by the PL2 value (64W for the Core i7-1360P in the NUC13ANKi7). The idling numbers are excellent, with the low power state achieved by the Arena Canyon NUC matched only by the Wall Street Canyon NUCs.
Stress Testing
Our thermal stress routine is a combination of Prime95, Furmark, and Finalwire's AIDA64 System Stability Test. The following 9-step sequence is followed, starting with the system at idle:
- Start with the Prime95 stress test configured for maximum power consumption
- After 30 minutes, add Furmark GPU stress workload
- After 30 minutes, terminate the Prime95 workload
- After 30 minutes, terminate the Furmark workload and let the system idle
- After 30 minutes of idling, start the AIDA64 System Stress Test (SST) with CPU, caches, and RAM activated
- After 30 minutes, terminate the previous AIDA64 SST and start a new one with the GPU, CPU, caches, and RAM activated
- After 30 minutes, terminate the previous AIDA64 SST and start a new one with only the GPU activated
- After 30 minutes, terminate the previous AIDA64 SST and start a new one with the CPU, GPU, caches, RAM, and SSD activated
- After 30 minutes, terminate the AIDA64 SST and let the system idle for 30 minutes
Traditionally, this test used to record the clock frequencies - however, with the increasing number of cores in modern processors and fine-grained clock control, frequency information makes the graphs cluttered and doesn't contribute much to understanding the thermal performance of the system. The focus is now on the power consumption and temperature profiles to determine if throttling is in play.
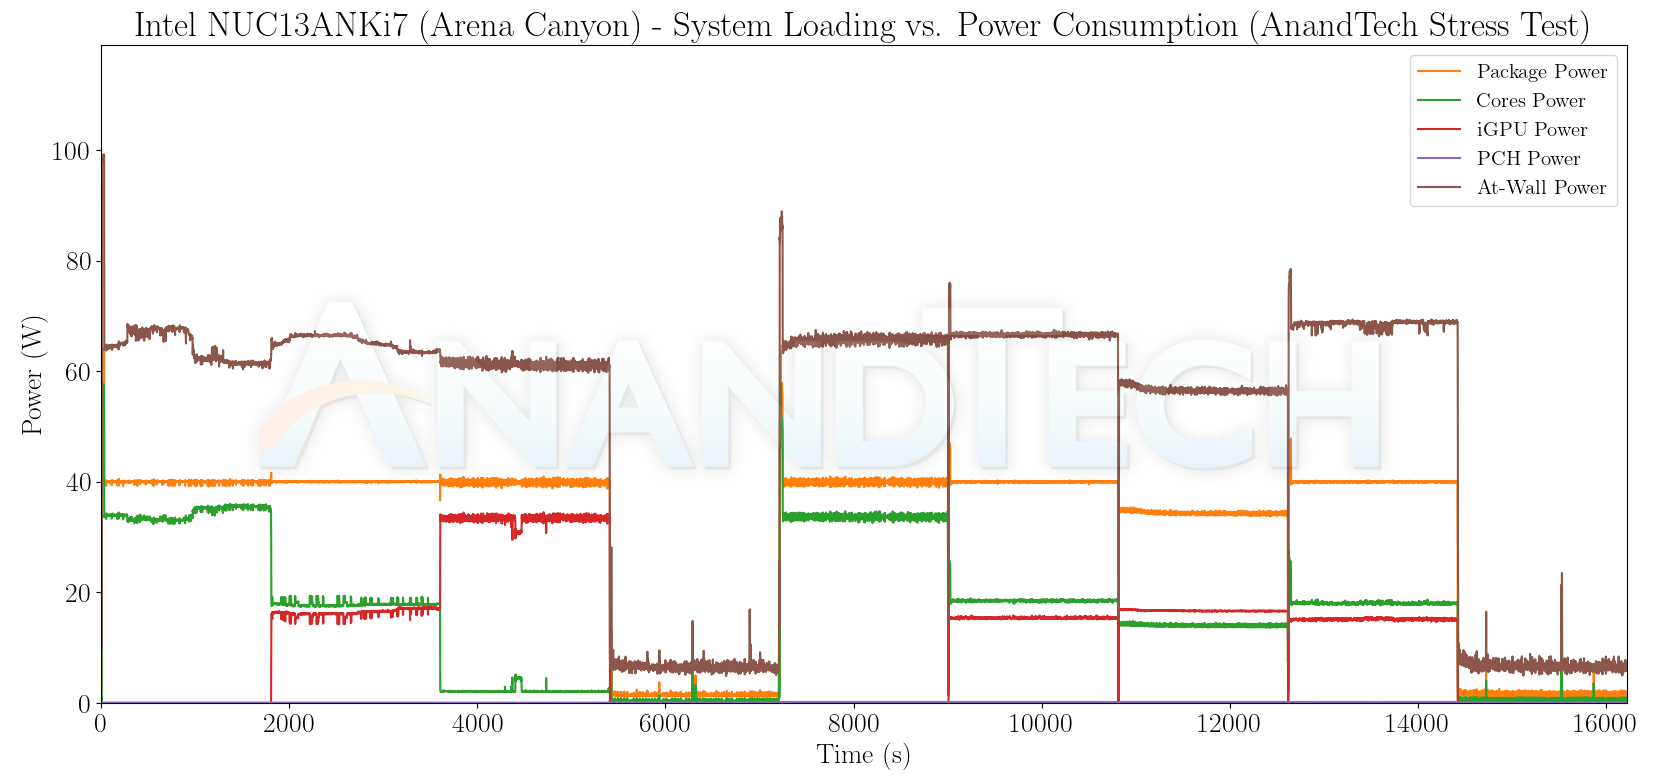
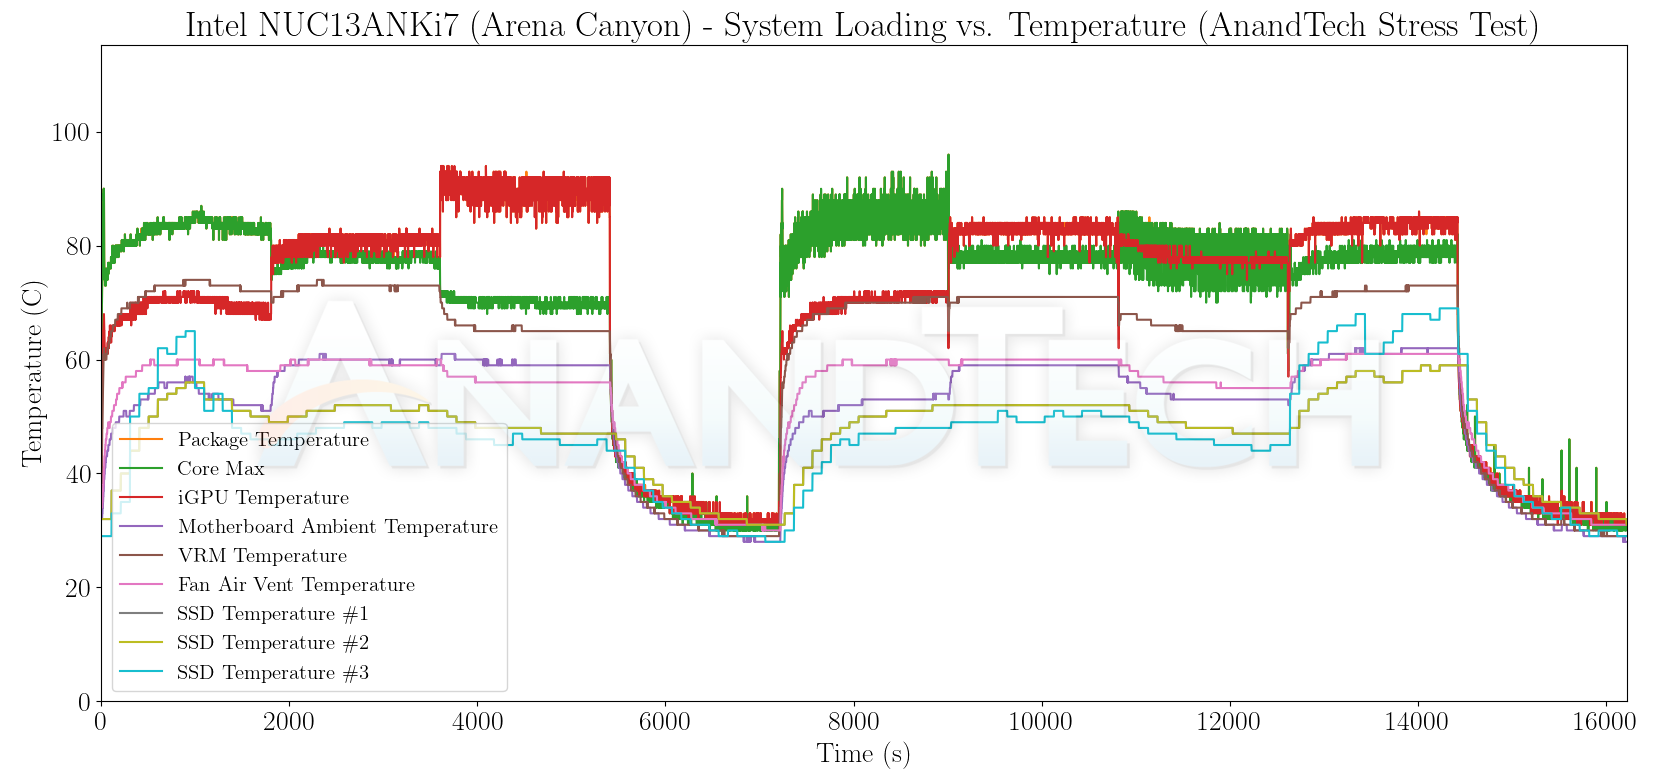
The system has no trouble maintaining a 40W package power throughout the loading period. The iGPU seems to have a maximum power budget of around 32W, with 18W being guaranteed even during high CPU load. The package temperature does reach around 92C, but never high enough for throttling to kick in. The SSD temperatures stay below 60C even when the disk is subject to stress.
Originally published at https://www.anandtech.com/show/18791/intel-nuc13-pro-arena-canyon-review-raptor-lake-brings-incremental-gains (Wayback Machine).