
Intel NUC 13 Pro Arena Canyon Review: Raptor Lake Brings Incremental Gains
System Performance: UL and BAPCo Benchmarks
Our 2022 Q4 update to the test suite for Windows 11-based systems carries over some of the standard benchmarks we have been using over the last several years, including UL's PCMark. New additions include BAPCo's CrossMark multi-platform benchmarking tool, as well as UL's Procyon benchmark suite. BPACo recently updated their SYSmark benchmark suite - while operational at a basic level, it is missing key features such as energy consumption measurement. We will start including SYSmark 30 once the open issues are resolved.
UL PCMark 10
UL's PCMark 10 evaluates computing systems for various usage scenarios (generic / essential tasks such as web browsing and starting up applications, productivity tasks such as editing spreadsheets and documents, gaming, and digital content creation). We benchmarked select PCs with the PCMark 10 Extended profile and recorded the scores for various scenarios. These scores are heavily influenced by the CPU and GPU in the system, though the RAM and storage device also play a part. The power plan was set to Balanced for all the PCs while processing the PCMark 10 benchmark. The scores for each contributing component / use-case environment are also graphed below.
| UL PCMark 10 - Performance Scores | |||
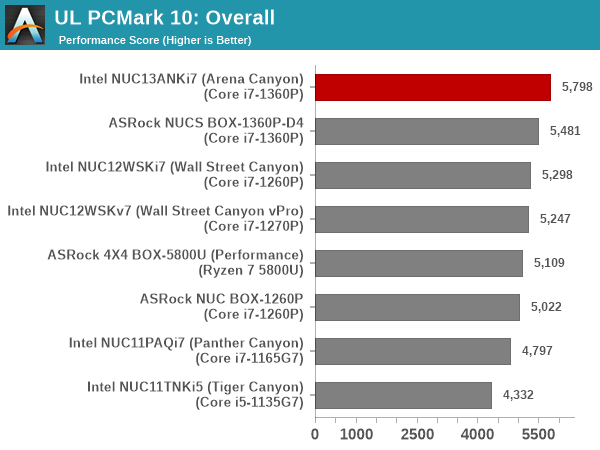
The productivity workload sees the Ryzen 7-5800U system come out on top (thanks probably to the presence of 8 high performance cores), but that system loses steam in other components. The overall scores are along expected lines - the Intel RPL-P system is ahead of the ASRock Industrial RPL-P one, which in turn is a bit in front of the Alder Lake-P systems.
UL Procyon v2.1.544
PCMark 10 utilizes open-source software such as Libre Office and GIMP to evaluate system performance. However, many of their professional benchmark customers have been requesting evaluation with commonly-used commercial software such as Microsoft Office and Adobe applications. In order to serve their needs, UL introduced the Procyon benchmark in late 2020. There are five benchmark categories currently - Office Productivity, AI Inference, Battery Life, Photo Editing, and Video Editing. AI Inference benchmarks are available only for Android devices, while the battery life benchmark is applicable to Windows devices such as notebooks and tablets. We presents results from our processing of the other three benchmarks.
| UL Procyon - Office Productivity Scores | |||
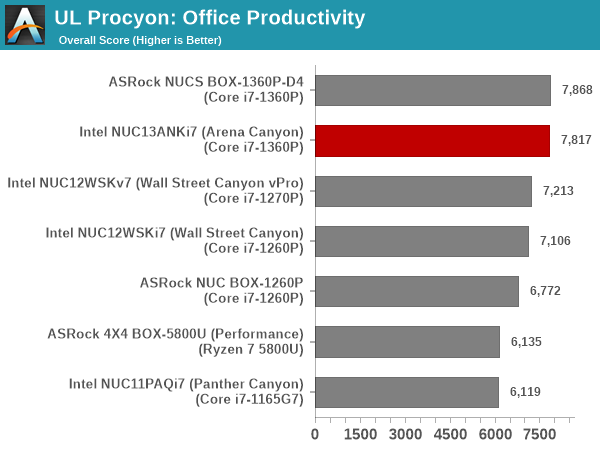
With similar processors and RAM, the NUCS BOX-1360P/D4 and the NUC13ANKi7 perform very similarly across all four components, getting on top in two each. The recorded scores are within the margin of run to run variations.
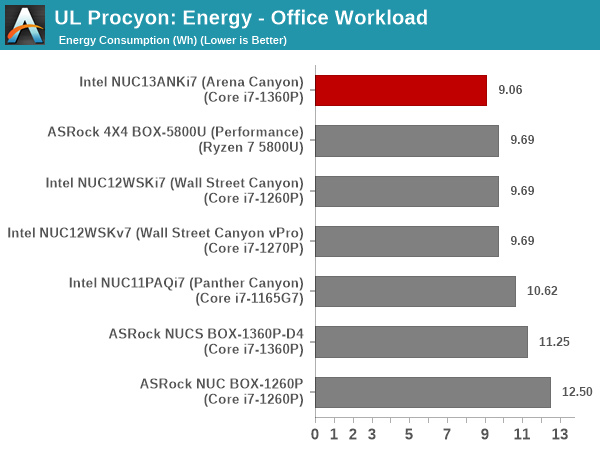
The Arena Canyon NUC forges ahead on the energy consumption front, though. In fact, the ASRock Industrial system comes way beind at 11.25 Wh compared to the Arena Canyon NUC's 9.06 Wh. These numbers can be due to different BIOS optimization targets.
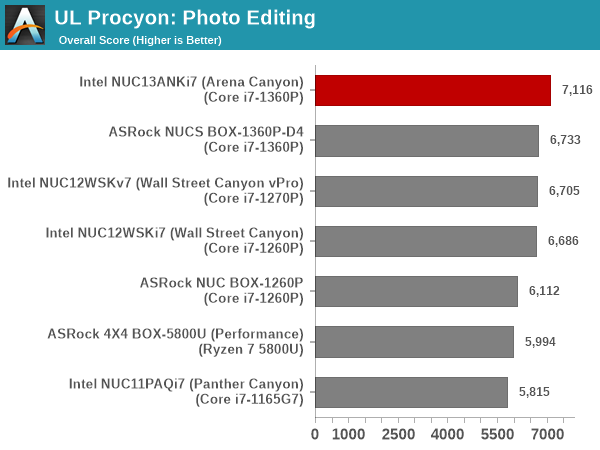
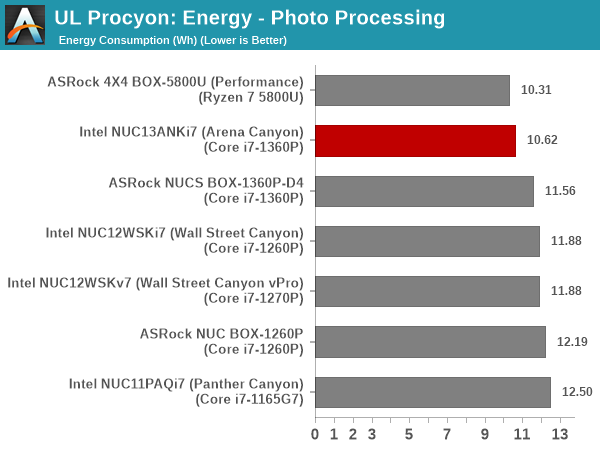
Moving on to the evaluation of Adobe Photoshop and Adobe Lightroom, we find the Arena Canyon NUC come out comfortably on top, but it guzzles a lot more energy in the process compared to the 4x4 BOX-5800U.
UL Procyon evaluates performance for video editing using Adobe Premier Pro, with the GPU playing a major role.
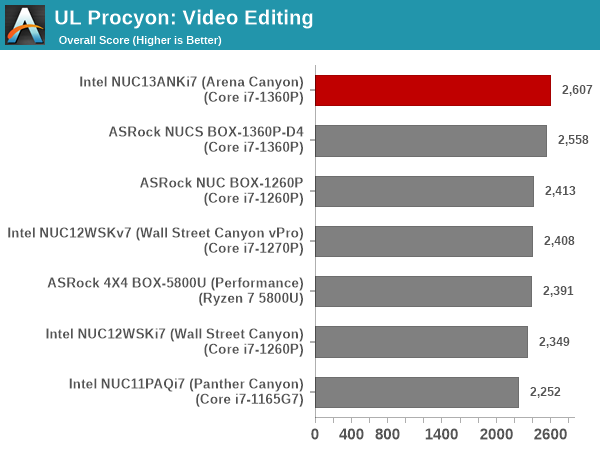
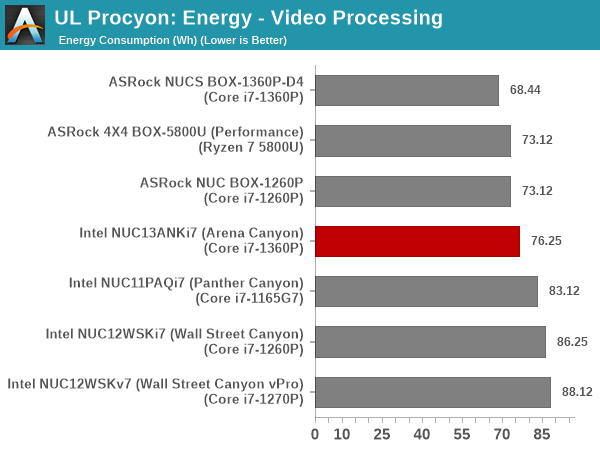
The aggressively clocked iGPU in the Core i7-1360P helps the Arena Canyon NUC and the NUCS BOX-1360P/D4 to deliver similar scores, with the former coming out on top. However, the energy consumption number is significantly higher despite the faster processing.
BAPCo CrossMark 1.0.1.86
BAPCo's CrossMark aims to simplify benchmark processing while still delivering scores that roughly tally with SYSmark. The main advantage is the cross-platform nature of the tool - allowing it to be run on smartphones and tablets as well.
| BAPCo CrossMark 1.0.1.86 - Sub-Category Scores | |||
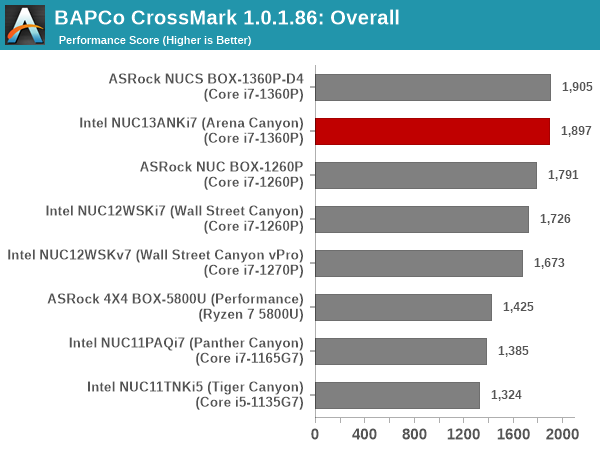
The relative performance seen in PCMark 10 translate to CrossMark also, as expected. The responsiveness ratings vary significantly due to differences in the default BIOS settings for options such as PCIe ASPM etc. We see the ASRock Industrial units emerge with high responsiveness ratings (ASPM disabled by default), while Arena Canyon opts to optimize for power efficiency by enabling ASPM. Overall, we see the Arena Canyon NUC score very similarly to the NUCS BOX-1360P/D4, and well ahead of the rest of the pack.
Originally published at https://www.anandtech.com/show/18791/intel-nuc13-pro-arena-canyon-review-raptor-lake-brings-incremental-gains (Wayback Machine).