
Intel Atlas Canyon (NUC11ATKPE) and GEEKOM MiniAir 11 UCFF PCs Review: Desktop Jasper Lake Impresses
Power Consumption and Thermal Characteristics
The power consumption at the wall was measured with a 4K display being driven through the HDMI port of the systems. In the graph below, we compare the idle and load power of the Intel NUC11ATKPE (Atlas Canyon) and the GEEKOM MiniAir 11 with other systems evaluated before. For load power consumption, we ran the AnandTech System Stress Test (a combination of Prime95, Furmark, and the AIDA64 System Stability Test with various stress components) and noted the peak as well as idling power consumption at the wall.
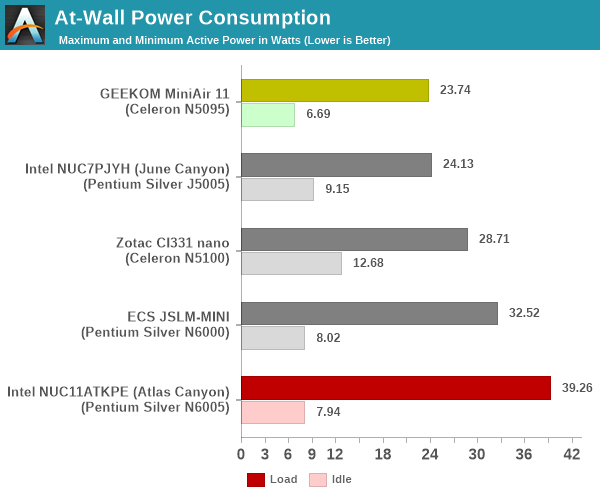
The numbers are consistent with the PL1 / PL2 values configured by the vendors in the systems, and do not come as any surprise. The low peak power consumption for the MiniAir 11 means that GEEKOM could potentially increase the power budget for the system to deliver more performance.
Stress Testing
Our thermal stress routine is a combination of Prime95, Furmark, and Finalwire's AIDA64 System Stability Test. The following 9-step sequence is followed, starting with the system at idle:
- Start with the Prime95 stress test configured for maximum power consumption
- After 30 minutes, add Furmark GPU stress workload
- After 30 minutes, terminate the Prime95 workload
- After 30 minutes, terminate the Furmark workload and let the system idle
- After 30 minutes of idling, start the AIDA64 System Stress Test (SST) with CPU, caches, and RAM activated
- After 30 minutes, terminate the previous AIDA64 SST and start a new one with the GPU, CPU, caches, and RAM activated
- After 30 minutes, terminate the previous AIDA64 SST and start a new one with only the GPU activated
- After 30 minutes, terminate the previous AIDA64 SST and start a new one with the CPU, GPU, caches, RAM, and SSD activated
- After 30 minutes, terminate the AIDA64 SST and let the system idle for 30 minutes
Traditionally, this test used to record the clock frequencies - however, with the increasing number of cores in modern processors and fine-grained clock control, frequency information makes the graphs cluttered and doesn't contribute much to understanding the thermal performance of the system. The focus is now on the power consumption and temperature profiles to determine if throttling is in play.


The Atlas Canyon NUC can ramp up package power to around 22W for almost a minute to deliver maximum possible performance before ramping down to the PL1 limit of 15W. The cores themselves seem to get slightly upwards of 10W as the power budget. With both CPU and GPU in the mix, the ratio seems to be 6W for the CPU and 4W for the GPU. The GPU alone seems to grab up to 5W. Idling package power is below 5W. The temperatures stay well south of 80C - pointing to a thermal solution that is very effective. The fan speeds range from 2150 RPM to 3100 RPM.


The MiniAir 11's package power barely crosses 10W, with a slight bump up to around 11.5W at the start of each stress component. The maximum GPU power budget seems to be only around 2W. The temperature graph presents a very rosy picture, with the maximum temperature of the cores / package not crossing 72C. The SMART temperature readout of the SXMicro NF830 was broken - so we were unable to reliably record the SSD temperature during the process. Overall, GEEKOM's power budgeting has ensured that the MiniAir 11's thermals are excellent.
Originally published at https://www.anandtech.com/show/17488/intel-atlas-canyon-nuc11atkpe-and-geekom-miniair-11-ucff-pcs-review-desktop-jasper-lake-impresses (Wayback Machine).