
Sabrent Rocket Q4 and Corsair MP600 CORE NVMe SSDs Reviewed: PCIe 4.0 with QLC
AnandTech Storage Bench - The Destroyer
Our AnandTech Storage Bench tests are traces (recordings) of real-world IO patterns that are replayed onto the drives under test. The Destroyer is the longest and most difficult phase of our consumer SSD test suite. For more details, please see the overview of our 2021 Consumer SSD Benchmark Suite.
 |
|||||||||
| Average Data Rate | |||||||||
| Average Latency | Average Read Latency | Average Write Latency | |||||||
| 99th Percentile Latency | 99th Percentile Read Latency | 99th Percentile Write Latency | |||||||
| Energy Usage | |||||||||
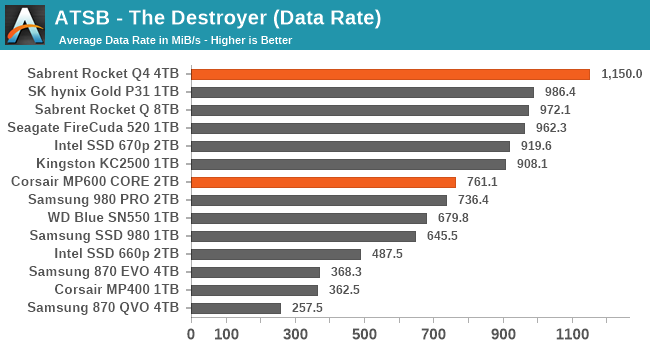
The 4TB Sabrent Rocket Q4 turns in excellent scores on The Destroyer, helped greatly by the fact that the test fits entirely within the drive's SLC cache so write latency is minimal. The 2TB Corsair MP600 CORE still has decent overall performance with solid 99th percentile latency scores indicating that it doesn't run into the kind of severe latency spikes that can be common with QLC NAND.
The major downside is that these are among the most power-hungry drives, consuming a bit more energy than the TLC-based Phison E16 drive and significantly more than any of the other drives in this batch.
AnandTech Storage Bench - Heavy
The ATSB Heavy test is much shorter overall than The Destroyer, but is still fairly write-intensive. We run this test twice: first on a mostly-empty drive, and again on a completely full drive to show the worst-case performance.
 |
|||||||||
| Average Data Rate | |||||||||
| Average Latency | Average Read Latency | Average Write Latency | |||||||
| 99th Percentile Latency | 99th Percentile Read Latency | 99th Percentile Write Latency | |||||||
| Energy Usage | |||||||||
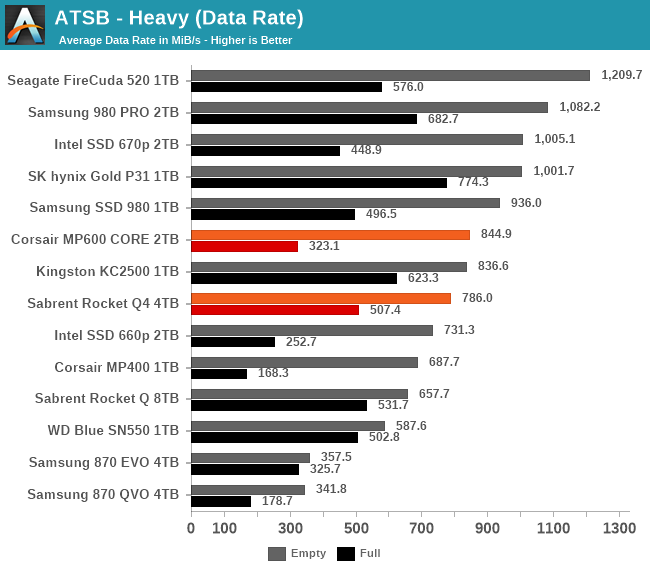
The shorter duration of the Heavy test means that smaller drives can also get good mileage out of their SLC caches, so the 4TB Sabrent Rocket Q4 loses the advantage it had on The Destroyer. The Rocket Q4 and the Corsair MP600 CORE both turn in good scores overall for low-end drives, with clear improvement over the Phison E12 QLC drives.
However, on the full-drive test runs the 2TB MP600 CORE is showing some elevated latency. It's not as bad as on QLC SATA drives and some competing QLC NVMe drives, so overall this isn't a serious concern, but it does emphasize how QLC SSDs need a lot of capacity (and a lot of SLC cache) in order to stay close to the performance of TLC SSDs.
AnandTech Storage Bench - Light
The ATSB Light test represents ordinary everyday usage that doesn't put much strain on a SSD. Low queue depths, short bursts of IO and a short overall test duration mean this should be easy for any SSD. But running it a second time on a full drive shows how even storage-light workloads can be affected by SSD performance degradation.
 |
|||||||||
| Average Data Rate | |||||||||
| Average Latency | Average Read Latency | Average Write Latency | |||||||
| 99th Percentile Latency | 99th Percentile Read Latency | 99th Percentile Write Latency | |||||||
| Energy Usage | |||||||||
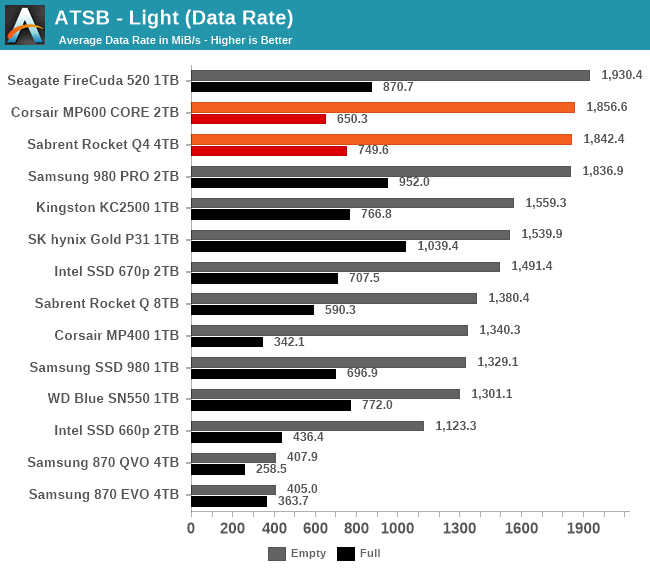
Both of the Gen4 QLC drives provide top-tier performance for the empty-drive runs of the Light test, and they also still provide acceptable performance on the full-drive test runs with no serious latency spikes. As with the other ATSB tests, they come in last place for energy efficiency.
PCMark 10 Storage Benchmarks
The PCMark 10 Storage benchmarks are IO trace based tests similar to our own ATSB tests. For more details, please see the overview of our 2021 Consumer SSD Benchmark Suite.
 |
|||||||||
| Full System Drive | Overall Score | Average Bandwidth | Average Latency | ||||||
| Quick System Drive | Overall Score | Average Bandwidth | Average Latency | ||||||
| Data Drive | Overall Score | Average Bandwidth | Average Latency | ||||||
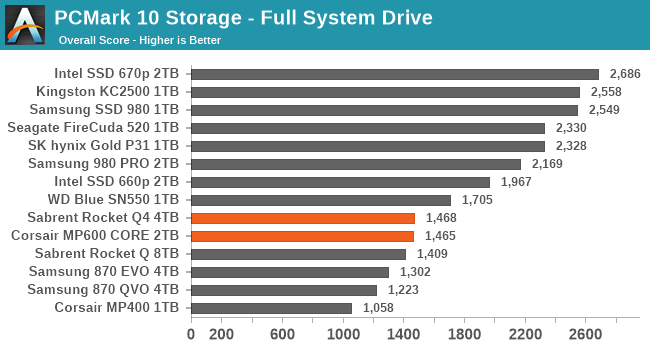
The two PCIe Gen4 QLC drives offer good performance on the Quick System Drive and Data Drive tests, which are relatively shorter and more focused on sequential IO. The longer Full System Drive test with more random IO stresses these drives enough for their low-end nature to show through - in stark contrast to the Intel SSD 670p that manages very good scores on both of the system drive tests.
Originally published at https://www.anandtech.com/show/16577/qlc-pcie-40 (Wayback Machine).