
The Samsung SSD 980 (500GB & 1TB) Review: Samsung's Entry NVMe
Advanced Synthetic Tests
Our benchmark suite includes a variety of tests that are less about replicating any real-world IO patterns, and more about exposing the inner workings of a drive with narrowly-focused tests. Many of these tests will show exaggerated differences between drives, and for the most part that should not be taken as a sign that one drive will be drastically faster for real-world usage. These tests are about satisfying curiosity, and are not good measures of overall drive performance. For more details, please see the overview of our 2021 Consumer SSD Benchmark Suite.
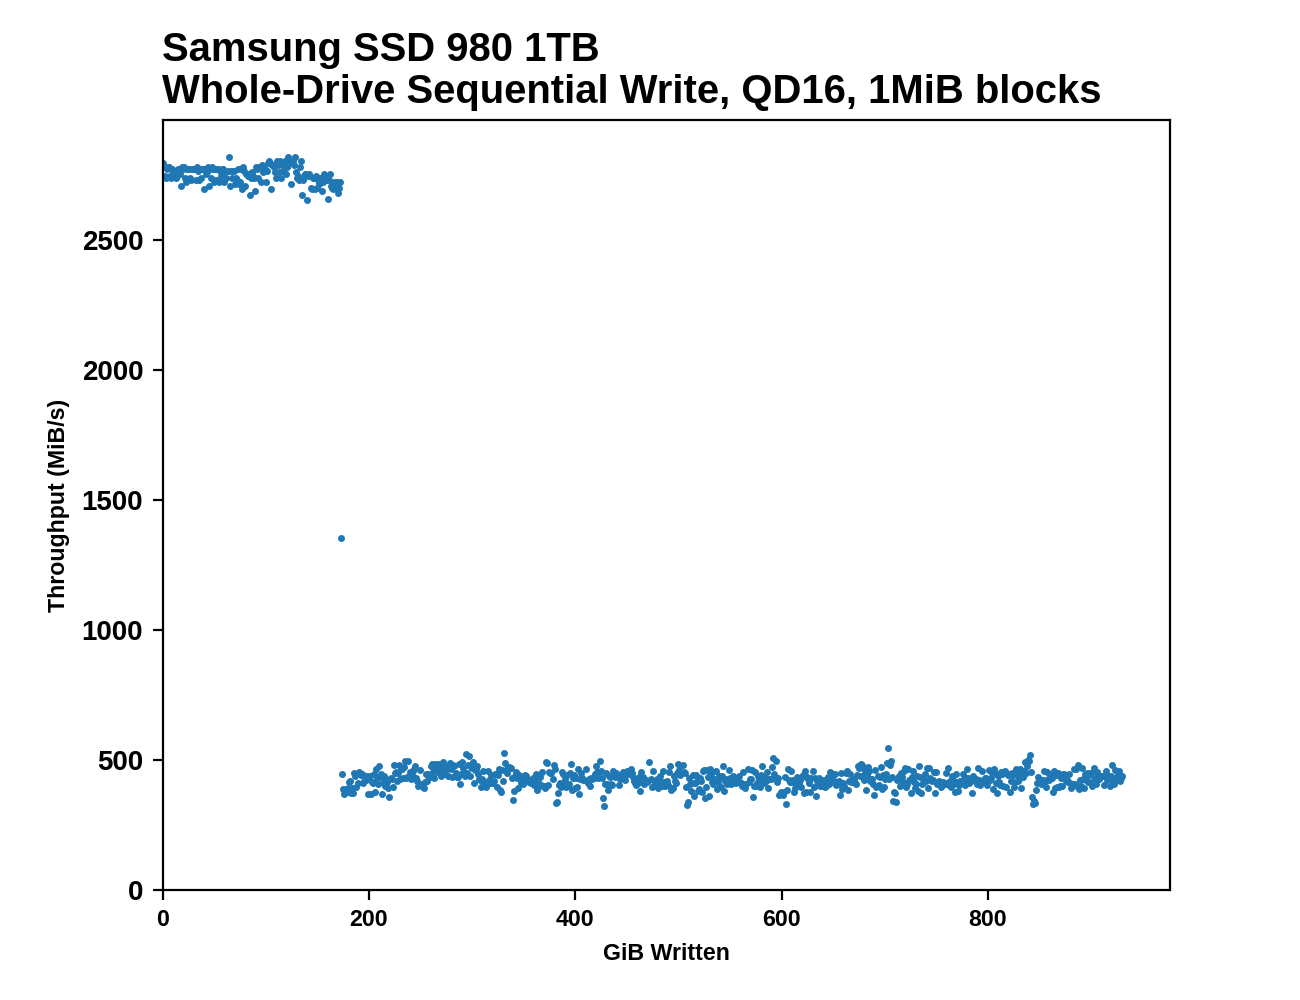
Whole-Drive Fill
 |
|||||||||
| Pass 1 | |||||||||
| Pass 2 | |||||||||
The Samsung SSD 980 clearly has larger SLC caches than the 970 EVO Plus or 980 PRO, as advertised. But post-cache performance is about a third that of the 970 EVO Plus when comparing the 1TB models, and the 500GB 980 is even slower post-cache. The apparent cache sizes are about 100GB for the 500GB model and 173GB for the 1TB model: a bit larger than advertised for the 1TB and a bit smaller than advertised for the 500 GB. On the second pass of filling the drives, the 1TB 980 never gets back up to full SLC cache speed, and the 500GB model only does for about 5GB. Samsung didn't give specs for the minimum SLC cache size, but it's clear there's not much left when the 980 is full.
 |
|||||||||
| Average Throughput for last 16 GB | Overall Average Throughput | ||||||||
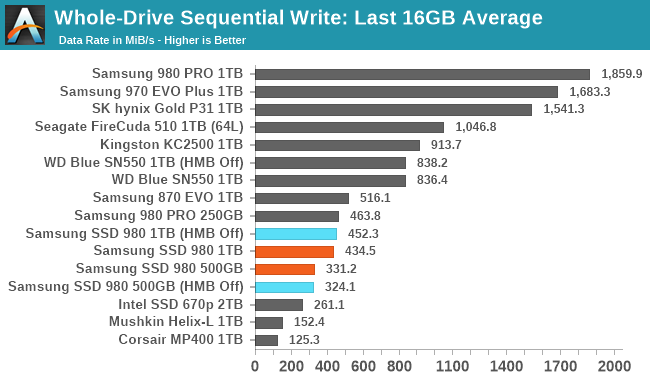
The 1TB SSD 980's performance on the whole-drive fill averages out to just a hair slower than the 1TB 870 EVO, and the 500GB model is about 25% slower than that. It's clear that both the narrower 4-channel controller and the lack of DRAM are both contributing to the lower write throughput of the SSD 980 as compared with Samsung's high-end NVMe drives.
Working Set Size
 |
|||||||||
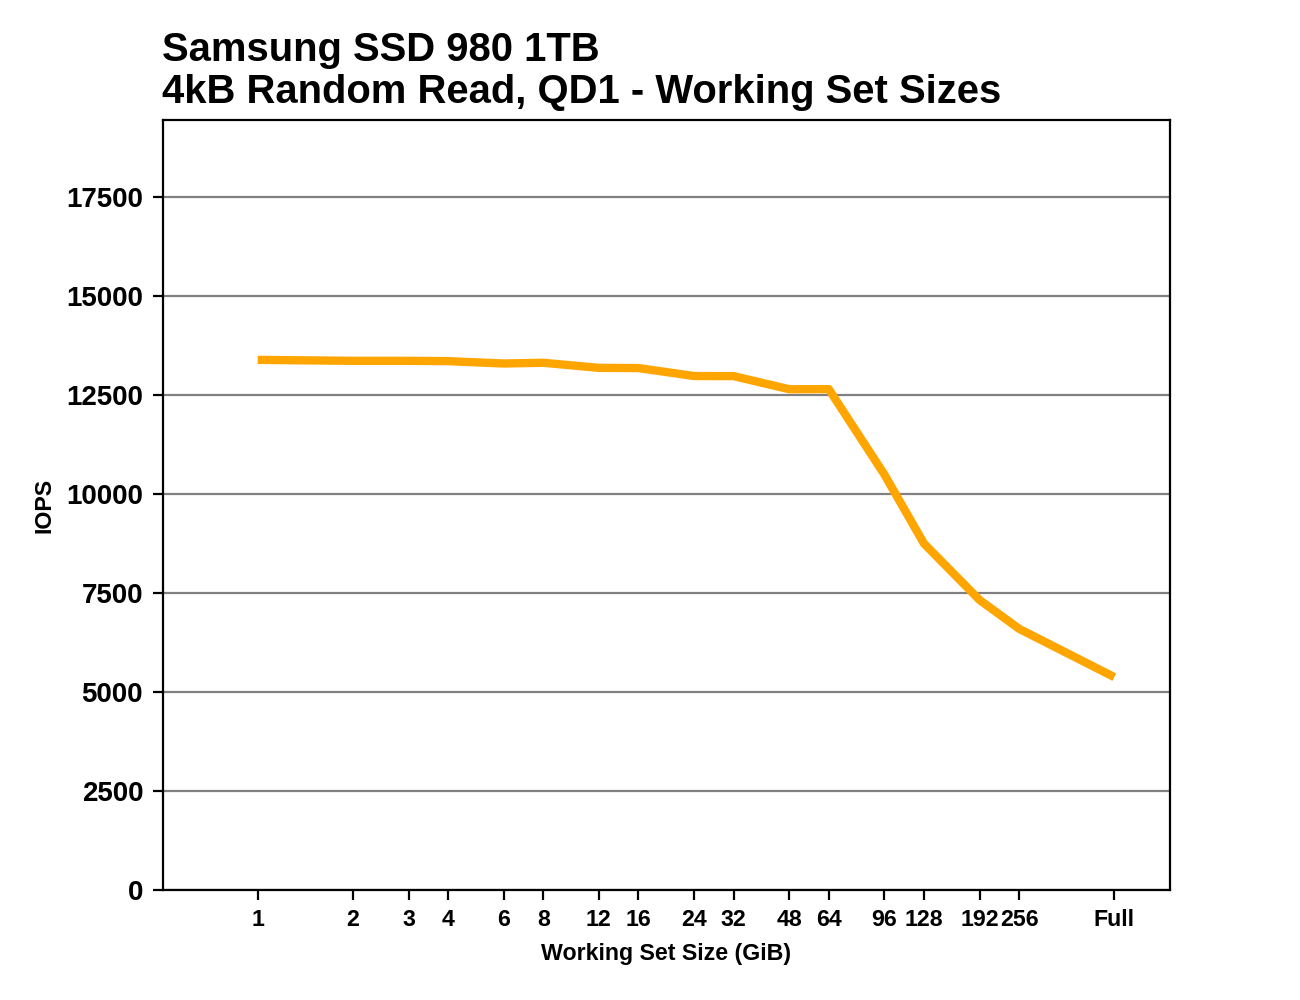
The 64MB Host Memory Buffer used by the SSD 980 is very clearly illustrated by this test. Without HMB enabled, the 980's random read performance suffers even for small working set sizes of just a few GB, indicating there's very little on-controller RAM. For extremely large working set sizes, the 980's performance drops below the SATA 870 EVO.
The WD Blue SN550 shows slightly worse random read performance than the SSD 980 for smaller working set sizes, and its smaller HMB allocation means performance starts dropping sooner. But at large working set sizes or with HMB off, the SN550 retains more performance, and the SN550 seems to have more on-chip RAM for use when HMB is unavailable.
Performance vs Block Size
 |
|||||||||
| Random Read | |||||||||
| Random Write | |||||||||
| Sequential Read | |||||||||
| Sequential Write | |||||||||
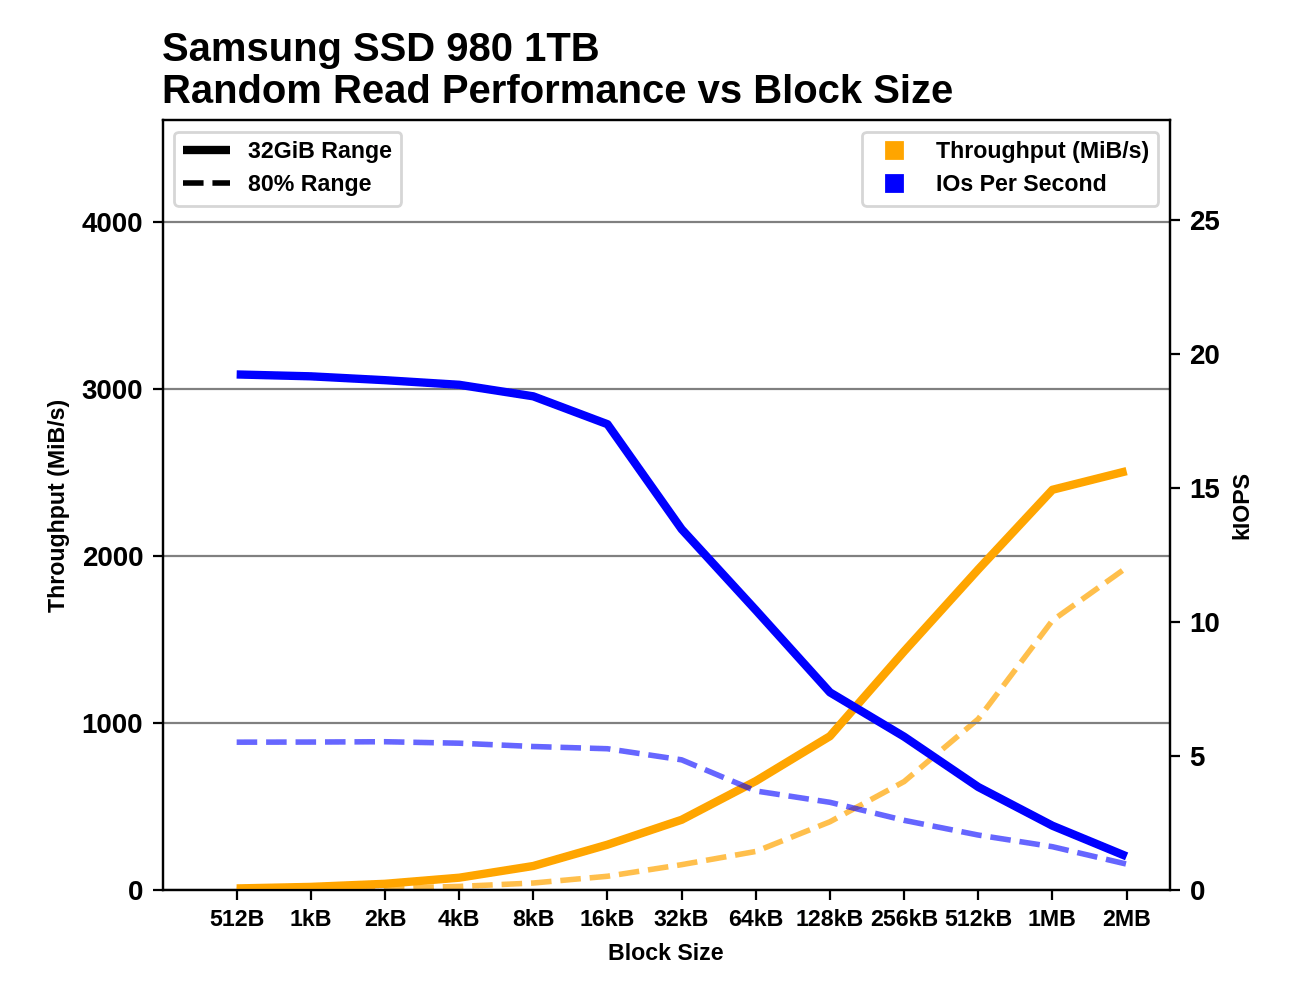
The Samsung SSD 980 maintains high random read IOPS up to block sizes of 16kB, and throughput starts to saturate once the block size is up to about 1MB. For random writes, IOPS starts dropping after 4kB, or after just 2kB when the test is hitting 80% of the drive. With HMB off, the 980 shows a clear preference for 4kB block size for random writes. Sequential reads show odd behavior for block sizes from 32kB to 128kB, with performance stalling then regressing despite increased block size. This happens for both capacities, with or without HMB, so it's a systemic quirk—and an unfortunate one, since 128kB is the usual block size for sequential IO benchmarks. For sequential writes the SSD 980 is well-behaved with smooth scaling of throughput as block sizes increase. Neither capacity of the SSD 980 runs into SLC cache size limits during these tests.
By contrast, the WD Blue SN550 shows much stronger signs of optimization specifically for 4kB block sizes: the effect is small for random reads but huge for random or sequential writes. Sub-4kB accesses are a generally not worth the trouble on the SN550. This drive also appears to occasionally run out of SLC cache during the random write block size testing.
Originally published at https://www.anandtech.com/show/16504/the-samsung-ssd-980-500gb-1tb-review (Wayback Machine).