
The Samsung SSD 980 (500GB & 1TB) Review: Samsung's Entry NVMe
AnandTech Storage Bench - The Destroyer
Our AnandTech Storage Bench tests are traces (recordings) of real-world IO patterns that are replayed onto the drives under test. The Destroyer is the longest and most difficult phase of our consumer SSD test suite. For more details, please see the overview of our 2021 Consumer SSD Benchmark Suite.
 |
|||||||||
| Average Data Rate | |||||||||
| Average Latency | Average Read Latency | Average Write Latency | |||||||
| 99th Percentile Latency | 99th Percentile Read Latency | 99th Percentile Write Latency | |||||||
| Energy Usage | |||||||||
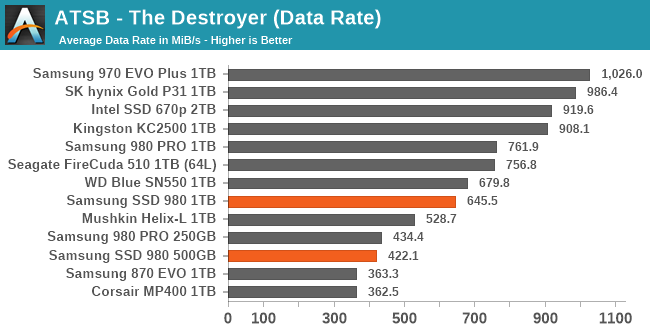
The Samsung SSD 980 turns in decent overall scores for an entry-level drive on The Destroyer, but it doesn't quite match the performance of the WD Blue SN550. In particular, Samsung's latency scores are quite a bit higher, especially for write operations. The 500 GB 980 struggles compared to the 1 TB model, but still pulls off an overall average data rate that's better than the 1TB SATA 870 EVO.
The SSD 980 does use less energy to complete The Destroyer than the 970 EVO Plus or 980 PRO did: slower and lower power worked out to lower overall energy consumption. But Samsung's performance-oriented NVMe drives have long been notable for their high energy consumption, and the SSD 980's results are nothing special in the context of other competitors on the market.
AnandTech Storage Bench - Heavy
The ATSB Heavy test is much shorter overall than The Destroyer, but is still fairly write-intensive. We run this test twice: first on a mostly-empty drive, and again on a completely full drive to show the worst-case performance.
 |
|||||||||
| Average Data Rate | |||||||||
| Average Latency | Average Read Latency | Average Write Latency | |||||||
| 99th Percentile Latency | 99th Percentile Read Latency | 99th Percentile Write Latency | |||||||
| Energy Usage | |||||||||
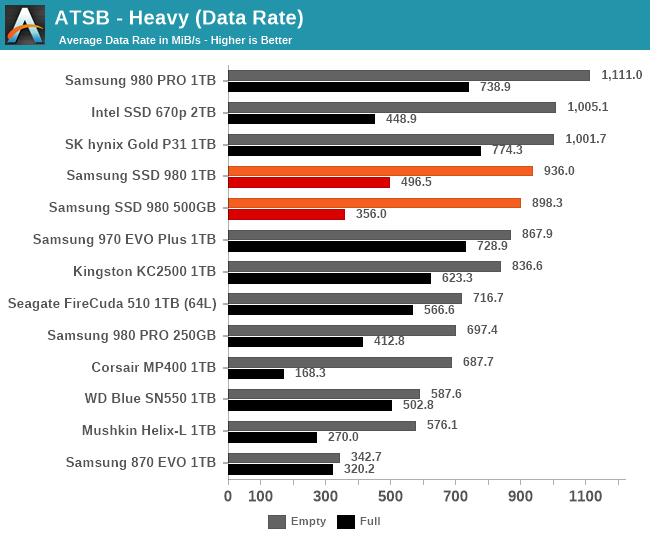
Moving on to the Heavy test, the Samsung SSD 980 improves its standings considerably. Performance when running the test on an empty drive is now competitive with mainstream TLC NVMe drives, including the latency scores. When the test is run on a full drive, the SSD 980's performance drops considerably, and it ends up on par with the WD Blue SN550. The 99th percentile latency scores are much higher for the full-drive test runs, but it's not an egregious outlier like a few of the other entry-level NVMe drives.
AnandTech Storage Bench - Light
The ATSB Light test represents ordinary everyday usage that doesn't put much strain on a SSD. Low queue depths, short bursts of IO and a short overall test duration mean this should be easy for any SSD. But running it a second time on a full drive shows how even storage-light workloads can be affected by SSD performance degradation.
 |
|||||||||
| Average Data Rate | |||||||||
| Average Latency | Average Read Latency | Average Write Latency | |||||||
| 99th Percentile Latency | 99th Percentile Read Latency | 99th Percentile Write Latency | |||||||
| Energy Usage | |||||||||
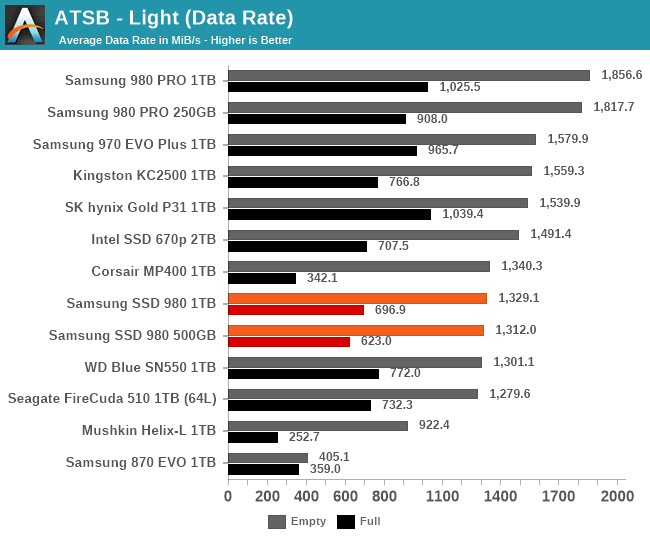
On the Light test, the Samsung SSD 980's performance is a step below mainstream TLC NVMe drives with DRAM, but it's not a huge difference. Even for the full-drive test runs, the latency scores all stay better than the 870 EVO SATA SSD, so there's nothing to complain about in that department. Energy consumption is a bit on the high side given that low-end drives often save quite a bit of power on light workloads, but the SSD 980 is still an improvement over Samsung's performance-oriented NVMe drives.
PCMark 10 Storage Benchmarks
The PCMark 10 Storage benchmarks are IO trace based tests similar to our own ATSB tests. For more details, please see the overview of our 2021 Consumer SSD Benchmark Suite.
 |
|||||||||
| Full System Drive | Overall Score | Average Bandwidth | Average Latency | ||||||
| Quick System Drive | Overall Score | Average Bandwidth | Average Latency | ||||||
| Data Drive | Overall Score | Average Bandwidth | Average Latency | ||||||
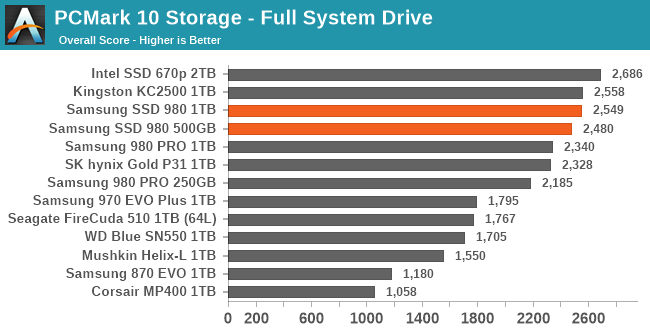
The Samsung SSD 980 scores very well on the Full System Drive, likely helped by the large SLC caches. Its rankings fall a bit with the Quick System Drive and Data Drive tests as more drives are also able to fit the tests within their SLC caches or pull ahead with higher sequential IO speeds.
Originally published at https://www.anandtech.com/show/16504/the-samsung-ssd-980-500gb-1tb-review (Wayback Machine).