
The Kingston DC500 Series Enterprise SATA SSDs Review: Making a Name In a Commodity Market
Peak Random Read Performance
For client/consumer SSDs we primarily focus on low queue depth performance for its relevance to interactive workloads. Server workloads are often intense enough to keep a pile of drives busy, so the maximum attainable throughput of enterprise SSDs is actually important. But it usually isn't a good idea to focus solely on throughput while ignoring latency, because somewhere down the line there's always an end user waiting for the server to respond.
In order to characterize the maximum throughput an SSD can reach, we need to test at a range of queue depths. Different drives will reach their full speed at different queue depths, and increasing the queue depth beyond that saturation point may be slightly detrimental to throughput, and will drastically and unnecessarily increase latency. Because of that, we are not going to compare drives at a single fixed queue depth. Instead, each drive was tested at a range of queue depths up to the excessively high QD 512. For each drive, the queue depth with the highest performance was identified. Rather than report that value, we're reporting the throughput, latency, and power efficiency for the lowest queue depth that provides at least 95% of the highest obtainable performance. This often yields much more reasonable latency numbers, and is representative of how a reasonable operating system's IO scheduler should behave. (Our tests have to be run with any such scheduler disabled, or we would not get the queue depths we ask for.)
One extra complication is the choice of how to generate a specified queue depth with software. A single thread can issue multiple I/O requests using asynchronous APIs, but this runs into at several problems: if each system call issues one read or write command, then context switch overhead becomes the bottleneck long before a high-end NVMe SSD's abilities are fully taxed. Alternatively, if many operations are batched together for each system call, then the real queue depth will vary significantly and it is harder to get an accurate picture of drive latency. Finally, the current Linux asynchronous IO APIs only work in a narrow range of scenarios. There is a new general-purpose async IO interface that will enable drastically lower overhead, but until that is adopted by applications other than our benchmarking tools, we're sticking with testing through the synchronous IO system calls that almost all Linux software uses. This means that we test at higher queue depths by using multiple threads, each issuing one read or write request at a time.
Using multiple threads to perform IO gets around the limits of single-core software overhead, and brings an extra advantage for NVMe SSDs: the use of multiple queues per drive. Enterprise NVMe drives typically support at least 32 separate IO queues, so we can have 32 threads on separate cores independently issuing IO without any need for synchronization or locking between threads.
 |
|||||||||
| Power Efficiency in kIOPS/W | Average Power in W | ||||||||
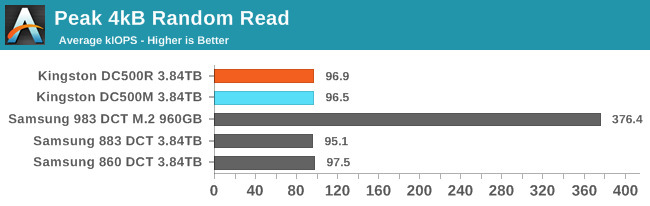
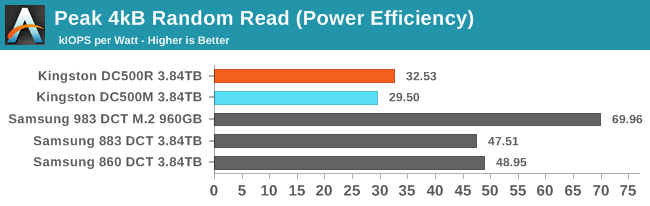
Now that we're looking at high queue depths, the SATA link becomes the bottleneck and performance equalizer. The Kingston DC500s and the Samsung SATA drives differ primarily in power efficiency, where Samsung again has a big advantage.
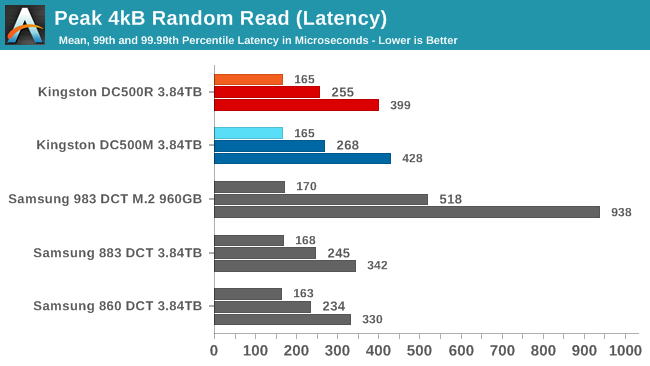
The Kingston DC500s have slightly worse QoS for random reads compared to the Samsung SATA drives. The Samsung entry-level NVMe drive has even higher tail latencies, but that's because it needs a queue depth four times higher than the SATA drives in order to reach its full speed, and that's getting close to hitting bottlenecks on the host CPU.
Peak Sequential Read Performance
Since this test consists of many threads each performing IO sequentially but without coordination between threads, there's more work for the SSD controller and less opportunity for pre-fetching than there would be with a single thread reading sequentially across the whole drive. The workload as tested bears closer resemblance to a file server streaming to several simultaneous users, rather than resembling a full-disk backup image creation.
 |
|||||||||
| Power Efficiency in MB/s/W | Average Power in W | ||||||||
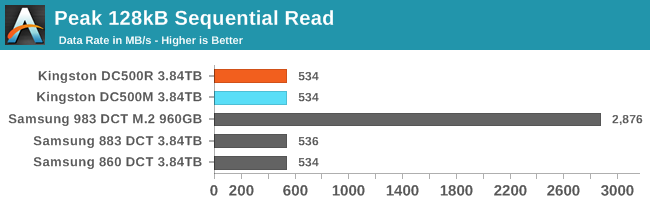
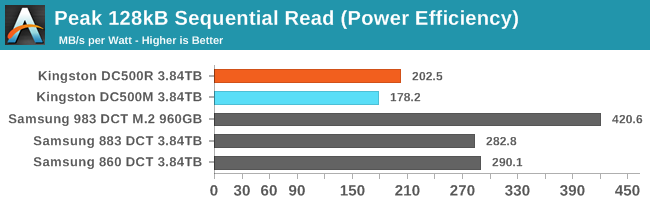
For sequential reads, the story at high queue depths is the same as for random reads. The SATA link is the bottleneck, so the difference comes down to power efficiency. The Kingston drives both blow past their official rating of 1.8W for reads, and have substantially lower efficiency than the Samsung SATA drives. The SATA drives are all at or near full throughput with a queue depth of four, while the NVMe drive is shown at QD8.
Steady-State Random Write Performance
The hardest task for most enterprise SSDs is to cope with an unending stream of writes. Once all the spare area granted by the high overprovisioning ratios has been used up, the drive has to perform garbage collection while simultaneously continuing to service new write requests, and all while maintaining consistent performance. The next two tests show how the drives hold up after hours of non-stop writes to an already full drive.
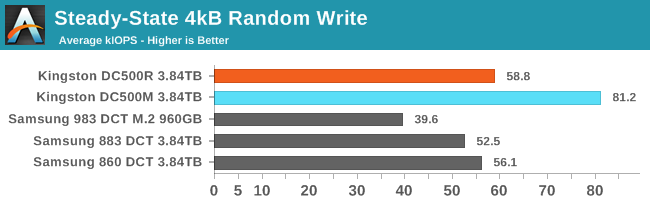
The Kingston DC500s looked pretty good at random writes when we were only considering QD1 performance, and now that we're looking at higher queue depths they still exceed expectations and beat the Samsung drives. The DC500M's 81.2k IOPS is above its rated 75k IOPS, but not by as much as the DC500R's 58.8k IOPS beats the specification of 28k IOPS. When testing across a wide range of queue depths, the DC500R didn't always maintain this throughput, but it was always above spec.
 |
|||||||||
| Power Efficiency in kIOPS/W | Average Power in W | ||||||||
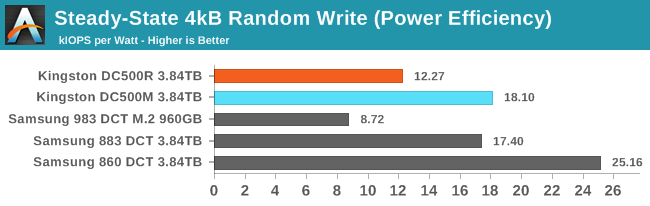
The Kingston DC500s are pretty power-hungry during the random write test, but they stay just under spec. The Samsung SATA SSDs draw much less power and match or exceed the efficiency of the Kingston drives even when performance is lower.
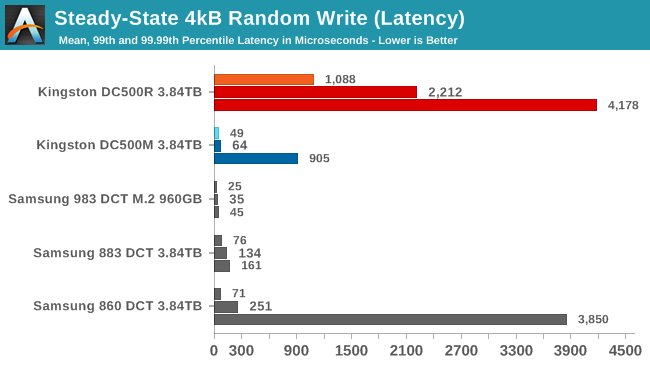
The DC500R's best performance while testing various random write queue depths happened when the queue depth was high enough to have significant software overhead from juggling so many thread, so it has pretty poor latency scores. It managed about 17% lower throughput with a mere QD4 where QoS was much better, but this test is set up to report how the drive behaved at or near the highest throughput observed. It's a bit concerning that the DC500R's throughput seems to be so variable, but since it's all faster than advertised, it's not a huge problem. The DC500M's great throughput was achieved even at pretty low queue depths, so the poor 99.99th percentile latency score is entirely the drive's fault rather than any artifact of the host system configuration. The Samsung 860 DCT has 99.99th percentile tail latency almost as bad as the DC500R, but the 860 was only running at QD4 at the time so that's another case where the drive is having trouble, not the host system.
Steady-State Sequential Write Performance
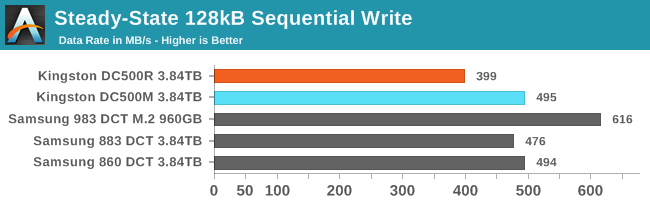
Testing at higher queue depths didn't help the DC500R do any better on our sequential write test, but the other SATA drives do get a bit closer to the SATA limit. Since this test uses multiple threads each performing sequential writes at QD1, going too high hurts performance because the SSD has to juggle multiple write streams. As a result, these SATA drives peaked with just QD2 and weren't quite as close to the SATA limit as they could have been with a single stream running at moderate queue depths.
 |
|||||||||
| Power Efficiency in MB/s/W | Average Power in W | ||||||||
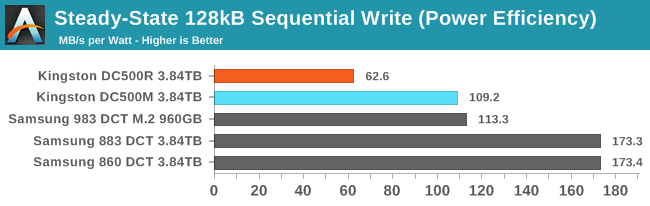
The Kingston DC500R's excessive power draw was commented on when this result turned up on the last page for the QD1 test, and it's still the most power-hungry and least efficient result here. The DC500M is drawing a bit more power than at QD1 but is within spec and manages to more or less match the efficiency of the NVMe drive, but Samsung's SATA drives again turn in much better efficiency scores.
Originally published at https://www.anandtech.com/show/14541/the-kingston-dc500-series-enterprise-sata-ssds-review (Wayback Machine).