
The NVIDIA GeForce GTX 1660 Ti Review, Feat. EVGA XC GAMING: Turing Sheds RTX for the Mainstream Market
Compute & Synthetics
Shifting gears, we'll look at the compute and synthetic aspects of the GTX 1660 Ti.
Beginning with CompuBench 2.0, the latest iteration of Kishonti's GPU compute benchmark suite offers a wide array of different practical compute workloads, and we’ve decided to focus on level set segmentation, optical flow modeling, and N-Body physics simulations.
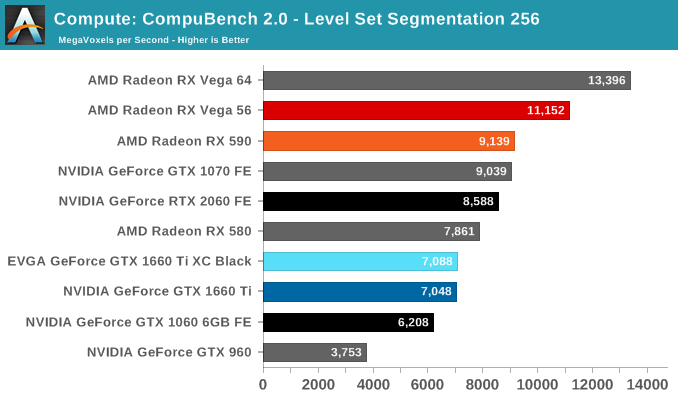
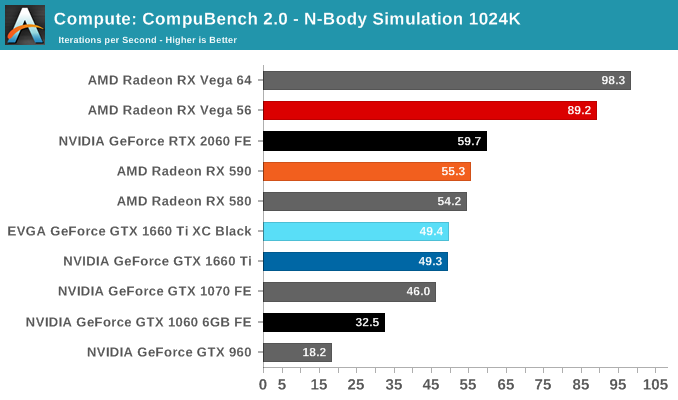
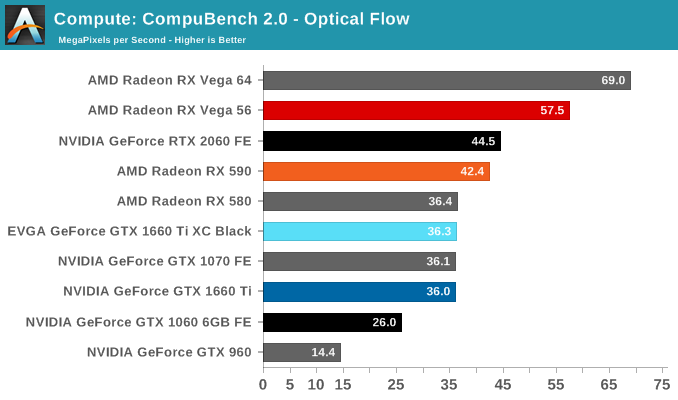
On paper, the GTX 1660 Ti looks to provide around 85% of the RTX 2060's compute and shading throughput; for Compubench, we see it achieving around 82% of the latter's performance.
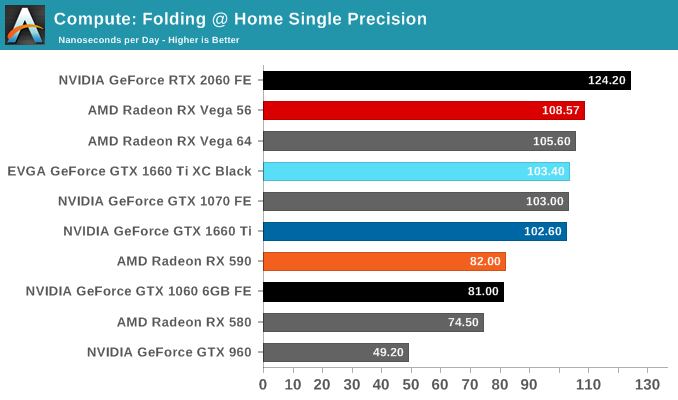
Moving on, we'll also look at single precision floating point performance with FAHBench, the official Folding @ Home benchmark. Folding @ Home is the popular Stanford-backed research and distributed computing initiative that has work distributed to millions of volunteer computers over the internet, each of which is responsible for a tiny slice of a protein folding simulation. FAHBench can test both single precision and double precision floating point performance, with single precision being the most useful metric for most consumer cards due to their low double precision performance.
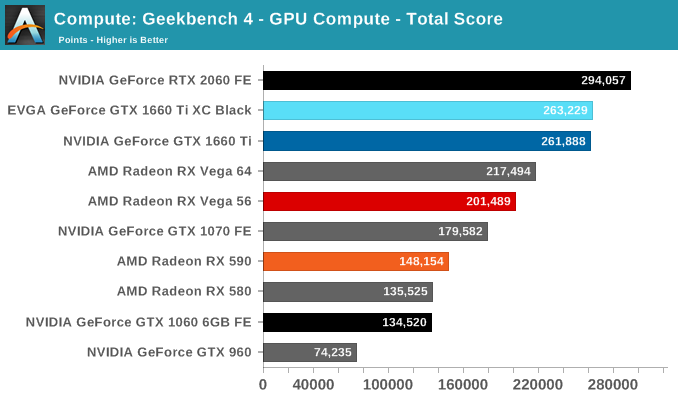
Next is Geekbench 4's GPU compute suite. A multi-faceted test suite, Geekbench 4 runs seven different GPU sub-tests, ranging from face detection to FFTs, and then averages out their scores via their geometric mean. As a result Geekbench 4 isn't testing any one workload, but rather is an average of many different basic workloads.
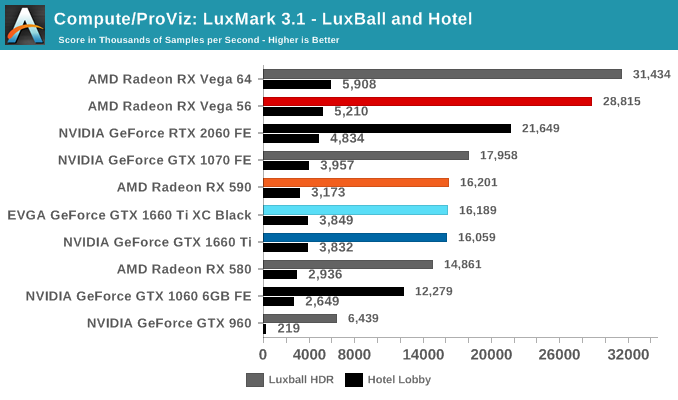
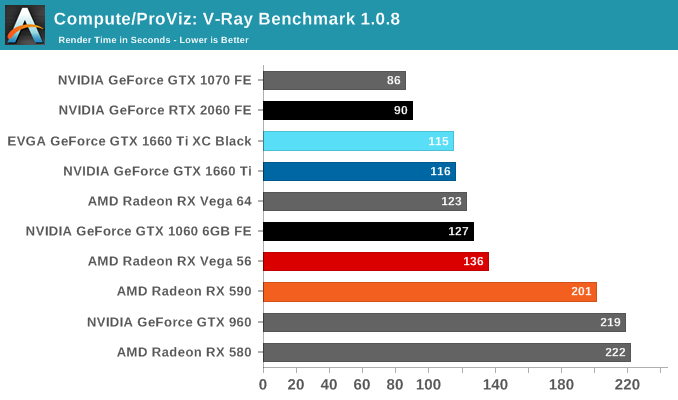
In lieu of Blender, which has yet to officially release a stable version with CUDA 10 support, we have the LuxRender-based LuxMark (OpenCL) and V-Ray (OpenCL and CUDA).
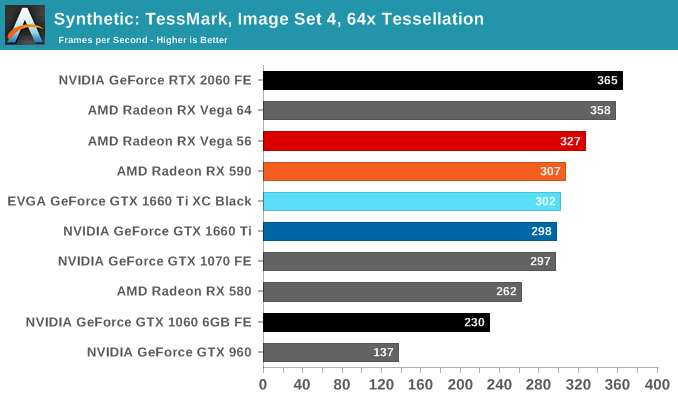
We'll also take a quick look at tessellation performance.
Finally, for looking at texel and pixel fillrate, we have the Beyond3D Test Suite. This test offers a slew of additional tests – many of which we use behind the scenes or in our earlier architectural analysis – but for now we’ll stick to simple pixel and texel fillrates.
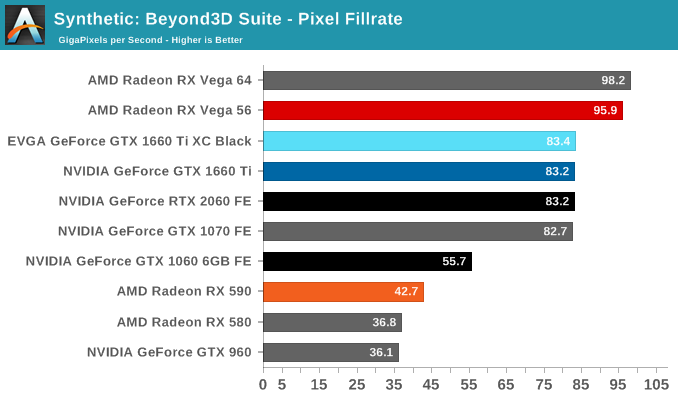
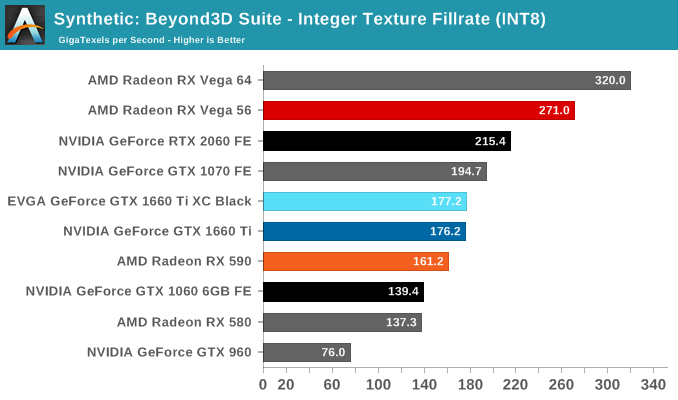
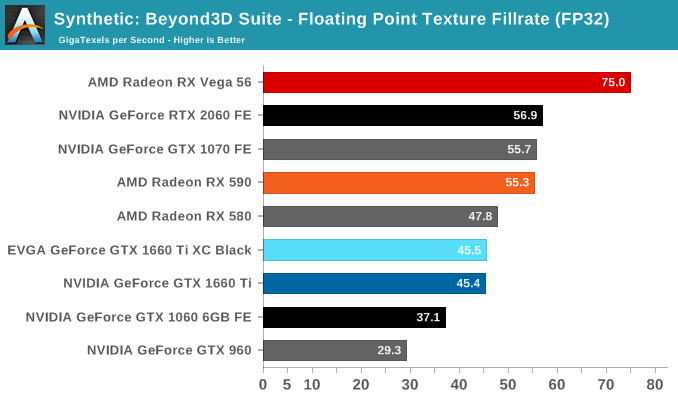
The practically identical pixel fill rates for the GTX 1660 Ti and RTX 2060 might seem odd at first blush, but it is an entirely expected result as both GPUs have the same number of ROPs, similar clockspeeds, same GPC/TPC setup, and similar memory configurations. And being the same generation/architecture, there aren't any changes or improvements to DCC. In the same vein, the RTX 2060 puts up a 25% higher texture fillrate over the GTX 1660 Ti as a consequence of having 25% more TMUs (96 vs 120).
Originally published at https://www.anandtech.com/show/13973/nvidia-gtx-1660-ti-review-feat-evga-xc-gaming (Wayback Machine).