
The Crucial P1 1TB SSD Review: The Other Consumer QLC SSD
Mixed Random Performance
Our test of mixed random reads and writes covers mixes varying from pure reads to pure writes at 10% increments. Each mix is tested for up to 1 minute or 32GB of data transferred. The test is conducted with a queue depth of 4, and is limited to a 64GB span of the drive. In between each mix, the drive is given idle time of up to one minute so that the overall duty cycle is 50%.
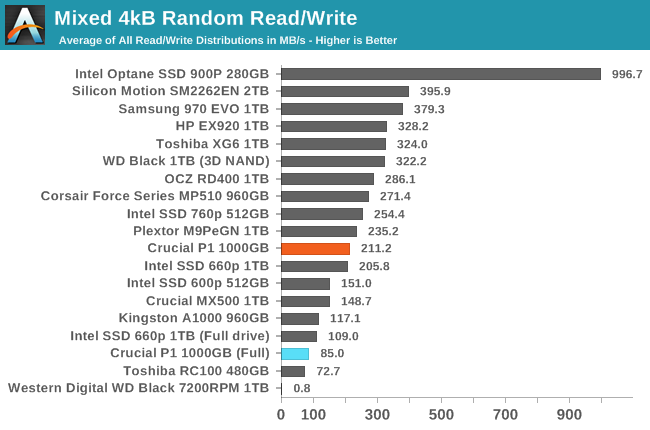
The Crucial P1 has reasonable entry-level NVMe performance on the mixed random I/O test. It's clearly faster than the MX500 SATA SSD and comes close to some high-end NVMe SSDs. But when the drive is full and the SLC cache is at its minimum size, the P1 slows down to 40% of its speed on a drive containing only the test data. When full, the P1 is about 22% slower than the Intel 660p, but their empty-drive performance is similar.
 |
|||||||||
| Power Efficiency in MB/s/W | Average Power in W | ||||||||
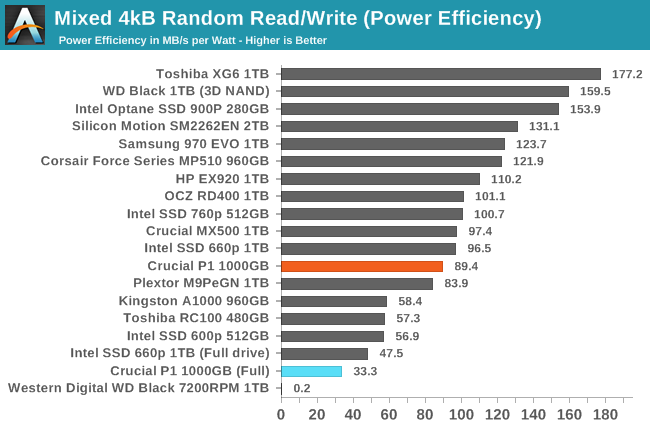
The Crucial P1 has worse power efficiency than the Intel 660p on this test, whether it is run on a full drive or not. The efficiency is still reasonable for the mostly-empty drive test run, but when full the P1's power consumption increases slightly and the efficiency is significantly worse than other low-end NVMe SSDs.
 |
|||||||||
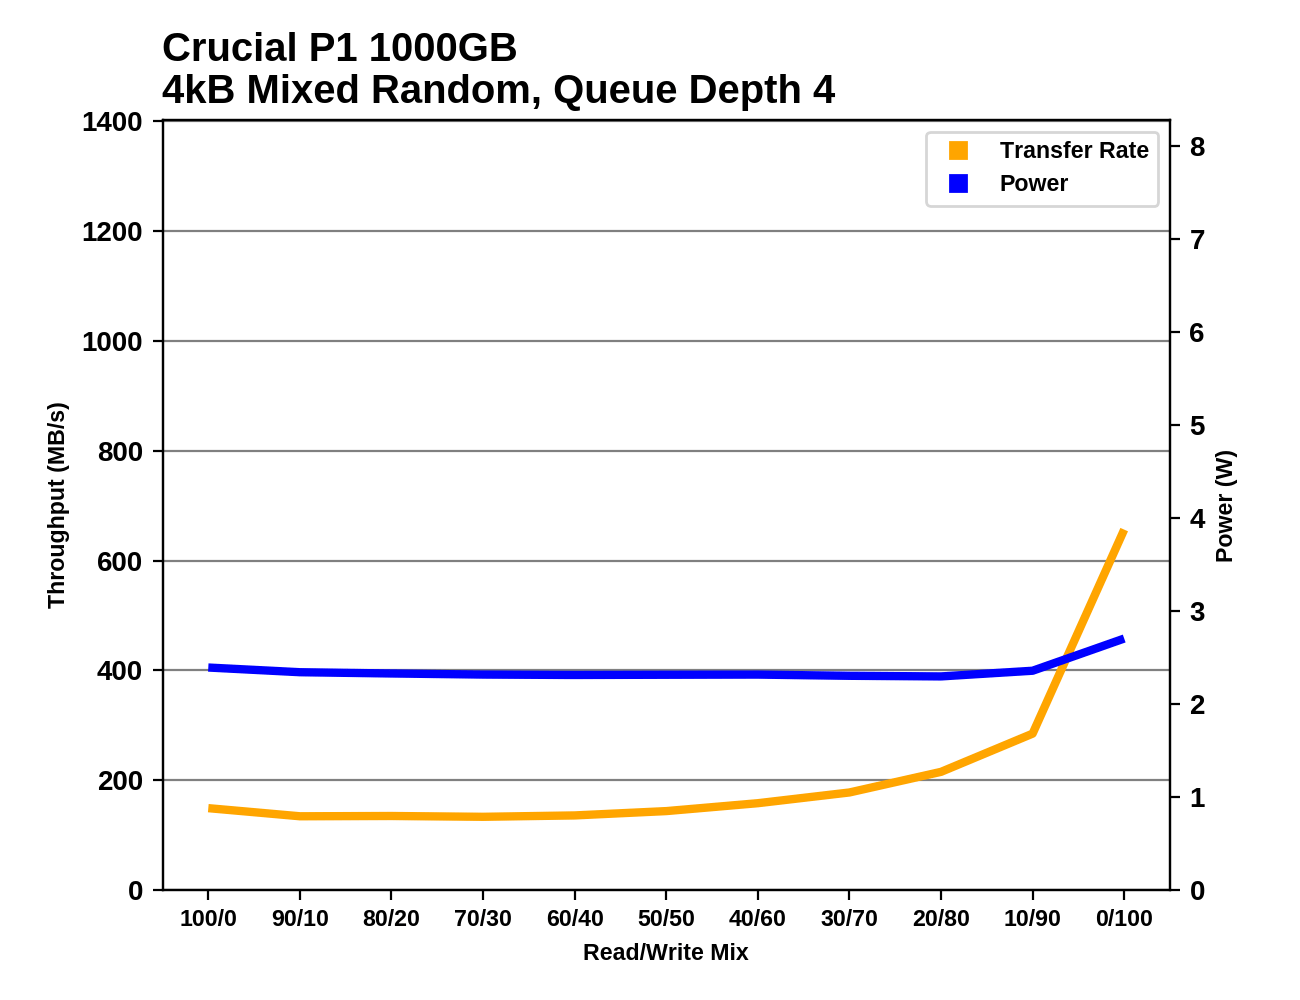
When the mixed random I/O test is run on a full Crucial P1, the benefits of the SLC cache almost completely disappear, leaving the drive with a mostly flat performance curve (with some inconsistency) rather than the significant performance upswing as the proportion of writes grows beyond 70%. The Intel 660p's performance is very similar save for slightly lower write performance to the SLC cache, and slightly improved full-drive performance.
Mixed Sequential Performance
Our test of mixed sequential reads and writes differs from the mixed random I/O test by performing 128kB sequential accesses rather than 4kB accesses at random locations, and the sequential test is conducted at queue depth 1. The range of mixes tested is the same, and the timing and limits on data transfers are also the same as above.
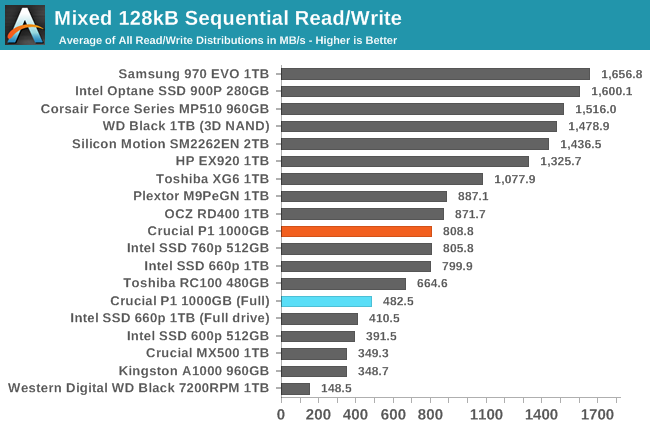
The performance of the Crucial P1 on the mixed sequential I/O test is better than most entry-level NVMe SSDs and comes close to some of the slower high-end drives. Even when the test is run on a full drive, the P1 remains faster than SATA SSDs, and its full-drive performance is slightly better than the Intel 660p.
 |
|||||||||
| Power Efficiency in MB/s/W | Average Power in W | ||||||||
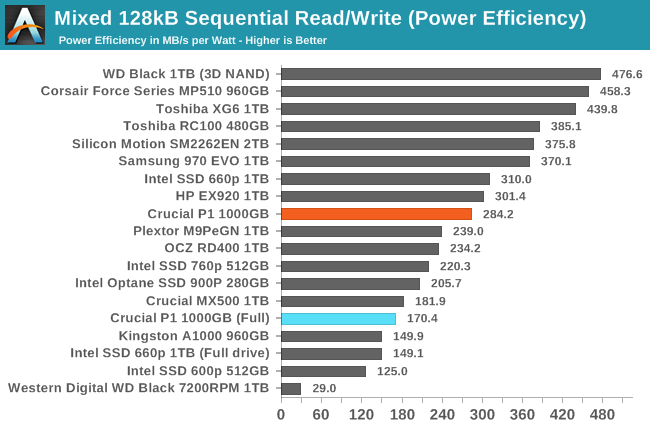
The power efficiency of the Crucial P1 on this test is about average for an entry-level NVMe drive. When the test is run on a full drive, the reduced performance causes efficiency to take a big hit, but it ends up being only slightly less efficient than the Crucial MX500 SATA SSD.
 |
|||||||||
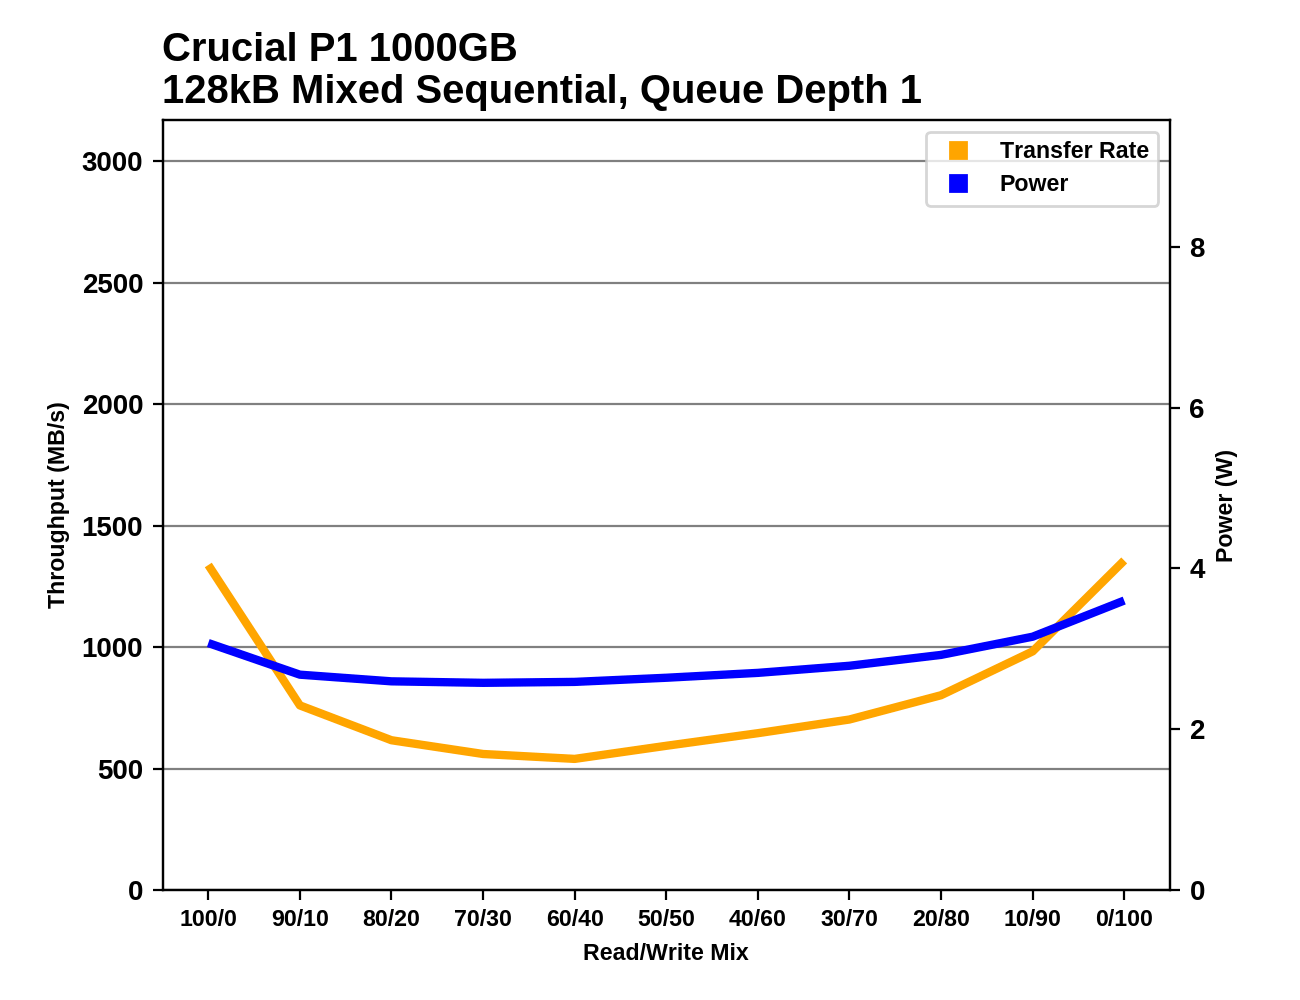
The Crucial P1 has decent performance at either end of the test, when the workload is either very read-heavy or very write-heavy. Compared to other entry-level NVMe drives, the P1 starts out with better read performance and recovers more of its performance toward the end of the test than many of its competitors. The minimum reached at around a 60/40 read/write split is faster than a SATA drive can manage but is unremarkable among NVMe drives. When the test is run on a full drive, performance during the more read-heavy half of the test is only slightly reduced, but things get worse throughout the write-heavy half of the test instead of improving as write caching comes more into play.
Originally published at https://www.anandtech.com/show/13512/the-crucial-p1-1tb-ssd-review (Wayback Machine).