
The MSI MEG X399 Creation Motherboard Review: The New 16-Phase Shark In Town
System Performance
Not all motherboards are created equal. On the face of it, they should all perform the same and differ only in the functionality they provide - however, this is not the case. The obvious pointers are power consumption, but also the ability for the manufacturer to optimize USB speed, audio quality (based on audio codec), POST time and latency. This can come down to the manufacturing process and prowess, so these are tested.
Power Consumption
Power consumption was tested on the system while in a single ASUS GTX 980 GPU configuration with a wall meter connected to the Thermaltake 1200W power supply. This power supply has ~75% efficiency > 50W, and 90%+ efficiency at 250W, suitable for both idle and multi-GPU loading. This method of power reading allows us to compare the power management of the UEFI and the board to supply components with power under load, and includes typical PSU losses due to efficiency. These are the real world values that consumers may expect from a typical system (minus the monitor) using this motherboard.
While this method for power measurement may not be ideal, and you feel these numbers are not representative due to the high wattage power supply being used (we use the same PSU to remain consistent over a series of reviews, and the fact that some boards on our test bed get tested with three or four high powered GPUs), the important point to take away is the relationship between the numbers. These boards are all under the same conditions, and thus the differences between them should be easy to spot.
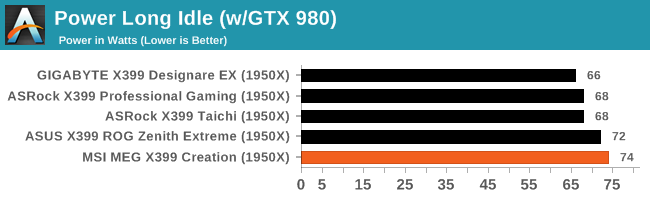
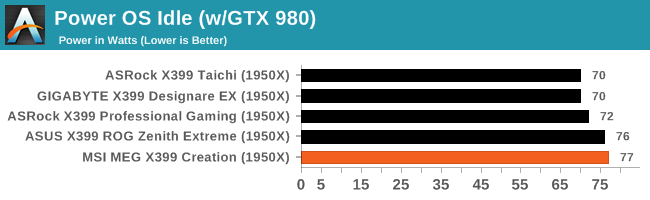
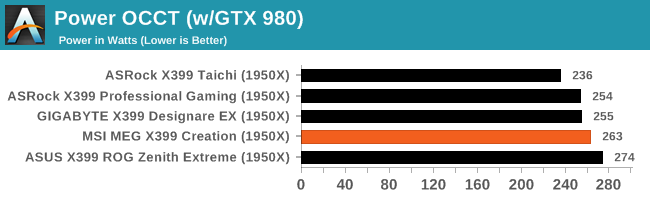
Aside from the other four boards being tested, the only major differences in specification are the graphics card and power supply used. In OCCT, the only variations are in the idle power draw of the components, but it's still a good indication of where power consumption should be. The MSI X399 Creation in a long idle and idle state pull slightly more watts at the wall than the other boards on test, but at full loud under OCCT, the power draw falls below that of the ASUS X399 ROG Zenith Extreme; a board on the same level specifications, feature and price wise.
Non-UEFI POST Time
Different motherboards have different POST sequences before an operating system is initialized. A lot of this is dependent on the board itself, and POST boot time is determined by the controllers on board (and the sequence of how those extras are organized). As part of our testing, we look at the POST Boot Time using a stopwatch. This is the time from pressing the ON button on the computer to when Windows starts loading. (We discount Windows loading as it is highly variable given Windows specific features.)
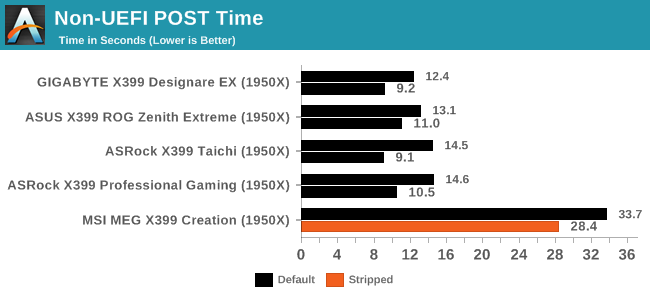
While the boot times of the other boards on test seem very quick indeed, the MSI MEG X399 Creation displayed some very long and dreary POST times. In a stripped state with controllers such as LAN, onboard audio and other disableable controllers turned off, POST times did improve but still come in more than double than the next slowest board. This could quite possibly be an anomaly, but as more X399 boards come in, I will re-test to see if it's a consistent issue with the test set-up, although nothing else seems amiss.
DPC Latency
Deferred Procedure Call latency is a way in which Windows handles interrupt servicing. In order to wait for a processor to acknowledge the request, the system will queue all interrupt requests by priority. Critical interrupts will be handled as soon as possible, whereas lesser priority requests such as audio will be further down the line. If the audio device requires data, it will have to wait until the request is processed before the buffer is filled.
If the device drivers of higher priority components in a system are poorly implemented, this can cause delays in request scheduling and process time. This can lead to an empty audio buffer and characteristic audible pauses, pops and clicks. The DPC latency checker measures how much time is taken processing DPCs from driver invocation. The lower the value will result in better audio transfer at smaller buffer sizes. Results are measured in microseconds.
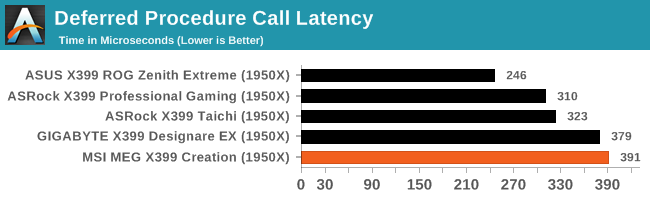
None of the boards tested has been optimized for DPC latency, and as it stands, the MSI MEG X399 Creation has posted the worst score so far. This is even though all of the tested offerings on the X399 chipset have been somewhat higher than usual as well.
Originally published at https://www.anandtech.com/show/13189/the-msi-meg-x399-creation-motherboard-review (Wayback Machine).