
Intel NUC6CAYH (Arches Canyon) Apollo Lake UCFF PC Review
Power Consumption and Thermal Performance
The power consumption at the wall was measured with a 4K display being driven through the HDMI 2.0 port. In the graphs below, we compare the idle and load power of the Intel NUC6CAYH with other low power PCs evaluated before. For load power consumption, we ran the AIDA64 System Stability Test with various stress components, as well as our power virus test, and noted the maximum sustained power consumption at the wall.
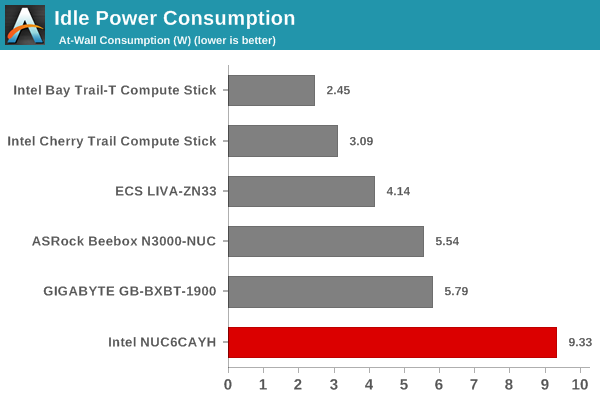
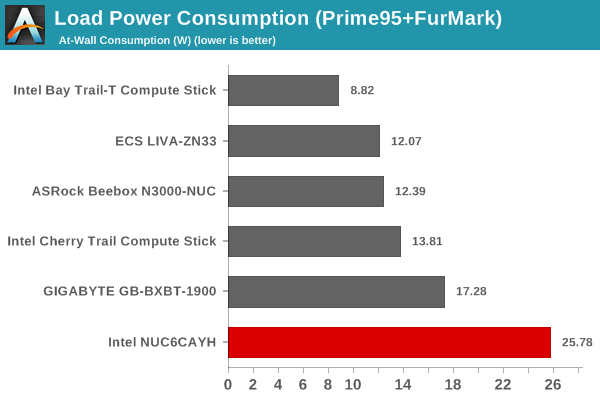
The Intel NUC6CAYH has a powerful CPU that wins in a majority of the presented benchmarks. But, it comes with a significant power penalty, both at idle and full loading.
Our thermal stress routine starts with the system at idle, followed by four stages of different system loading profiles using the AIDA64 System Stability Test (each of 30 minutes duration). In the first stage, we stress the CPU, caches and RAM. In the second stage, we add the GPU to the above list. In the third stage, we stress the GPU standalone. In the final stage, we stress all the system components (including the disks). Beyond this, we leave the unit idle in order to determine how quickly the various temperatures in the system can come back to normal idling range. The various clocks, temperatures and power consumption numbers for the system during the above routine are presented in the graphs below.
| Intel NUC6CAYH - AIDA64 System Stability Test | |||
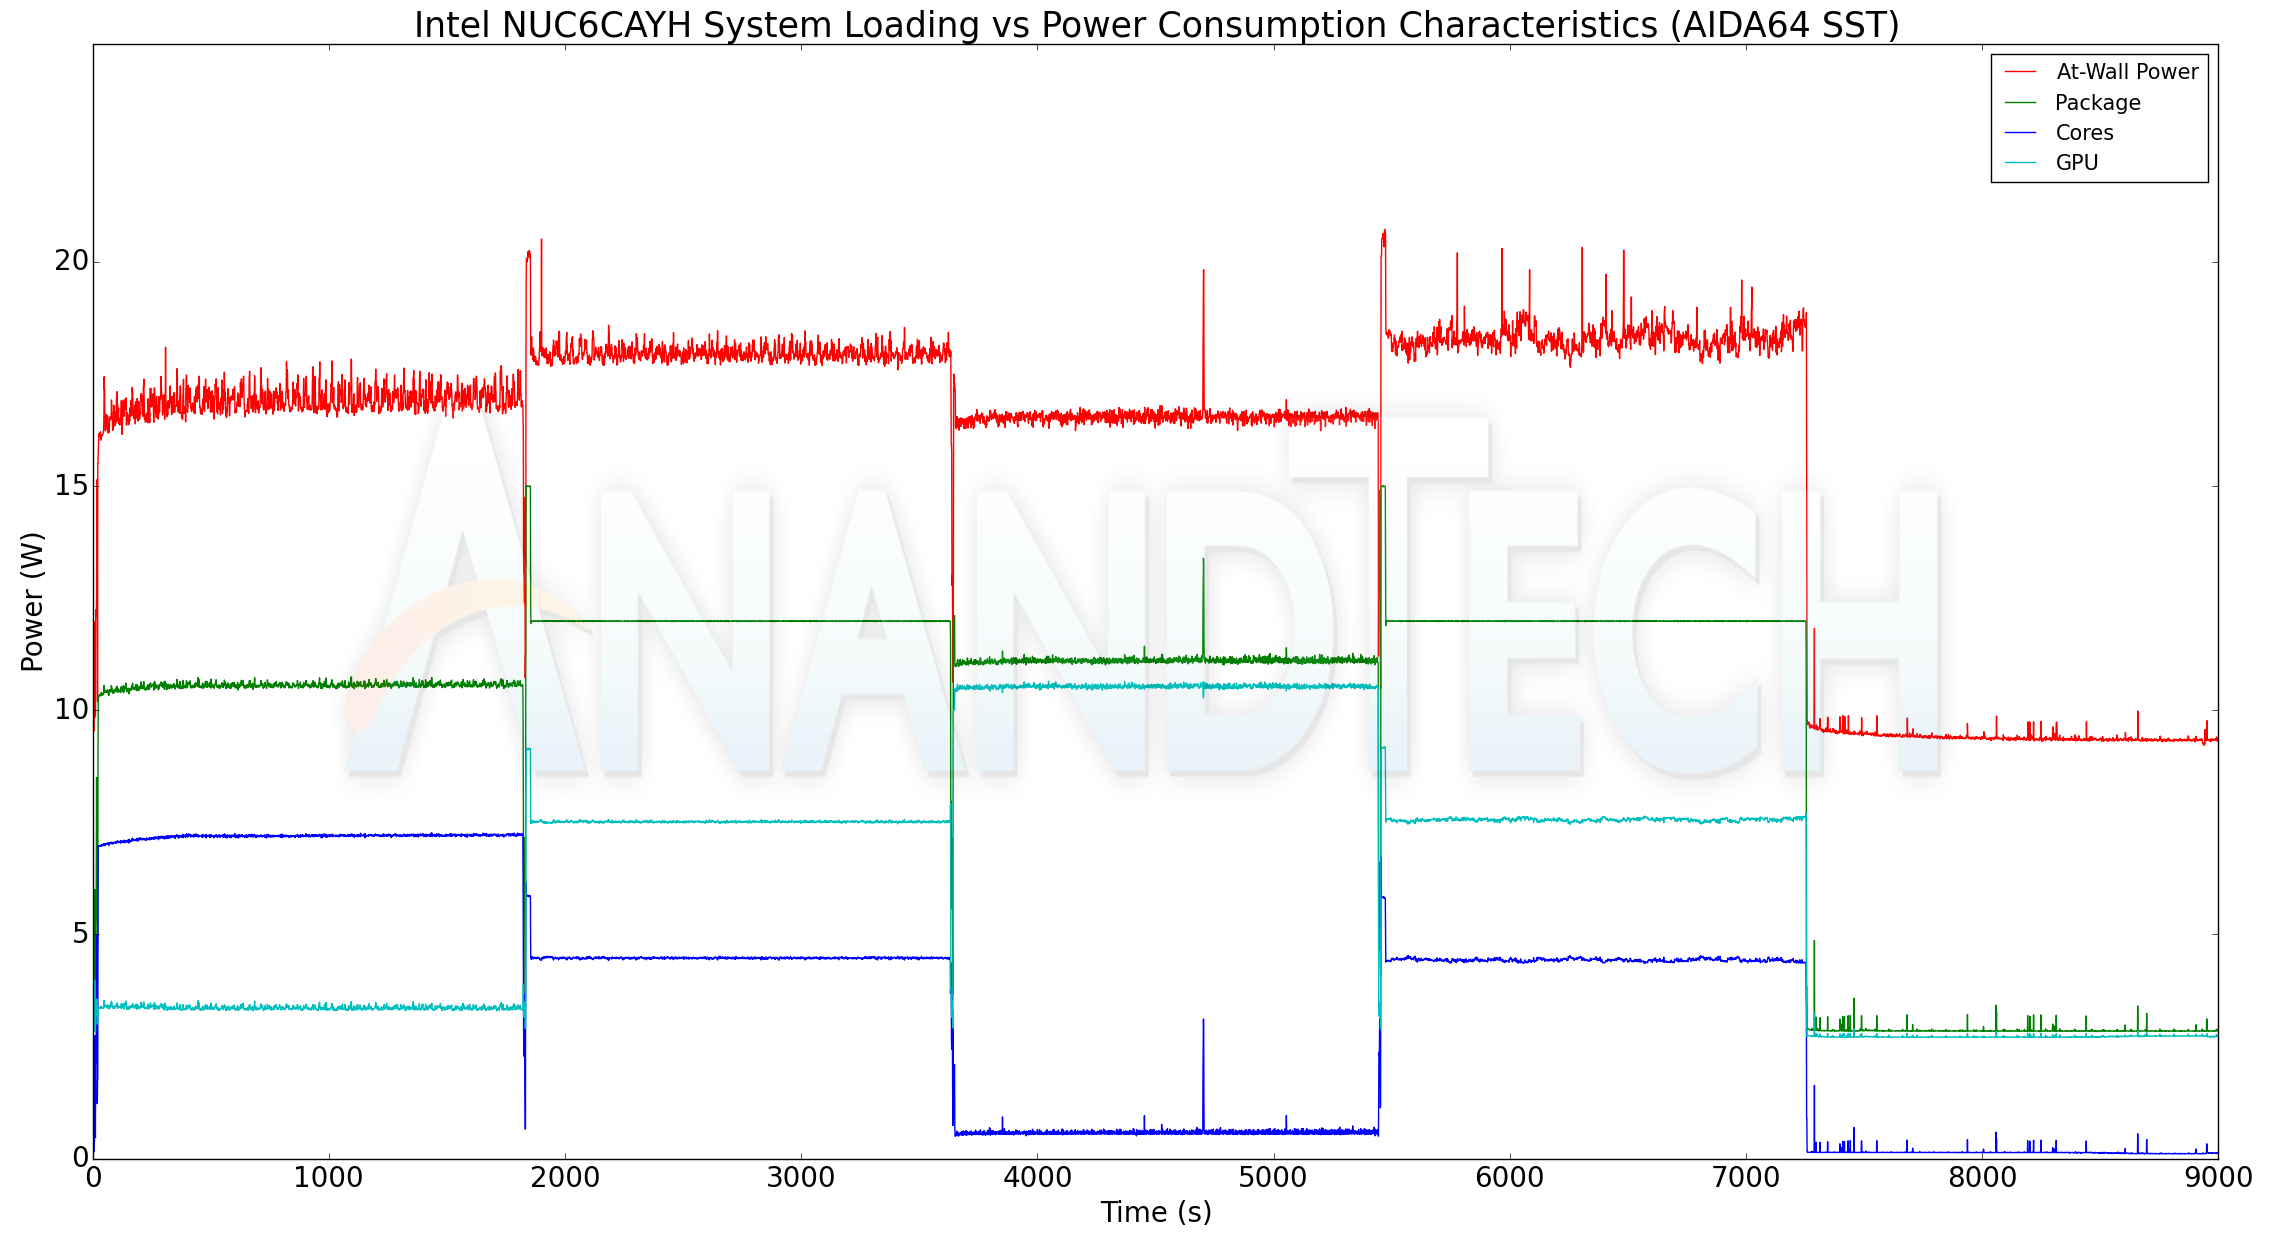
According to the official specifications of the Intel Celeron J3455, the junction temperature of the SoC is 105C. We do not see the numbers go anywhere that in the AIDA64 SST processing of the system. Interestingly, the package power seems to be configured for around 12.5W instead of 10W (as dictated by the TDP).
The AIDA64 system stability test uses real-world workloads to stress the system components. However, power virus tests such as the Prime 95 torture test and Furmark stability test can subject the system to greater stress. We repeated our thermal stress routine with 30 minutes of Prime 95 (v29.1), followed by 30 minutes of Prime 95 and Furmark (1.19.1). The Prime 95 load was then removed, and the GPU stressing Furmark test was allowed too run for another 30 minutes. The various clocks, temperatures and power consumption numbers for the system during the above routine are presented in the graphs below.
| Intel NUC6CAYH - Custom System Stability Test | |||
Here, we see the temperatures going up to 100C, but there is no throttling involved. Peak sustained power consumption numbers are also higher than what we encountered in the AIDA64 system stability test.
Originally published at https://www.anandtech.com/show/12295/intel-nuc6cayh-arches-canyon-apollo-lake-ucff-pc-review (Wayback Machine).