
Dissecting Intel's EPYC Benchmarks: Performance Through the Lens of Competitive Analysis
Database Performance & Variability
Results are very different with respect to transactional database benchmarks (HammerDB & OLTP). Intel's 8160 has an advantage of 22 to 29%, which is very similar to what we saw in our own independent benchmarking.

One of the main reasons is data locality: data is distributed over the many NUMA nodes causing extra latency for data access. Especially when data is locked, this can cause performance degradation.

Intel measured this with their own Memory Latency Checker (version 3.4), but you do not have rely on Intel alone. AMD reported similar results on the Linley Processor conference, and we saw similar results too.
There is more: Intel's engineers noticed quite a bit of performance variation between different runs.
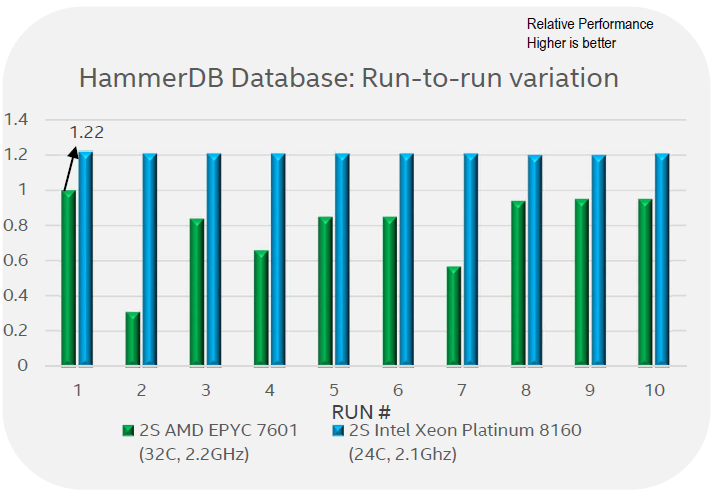
Intel engineers claim that what they reported in the first graph on this page is, in fact, the best of 10 runs. Between the 10 runs, it is claimed there was a lot of variability: ignoring the outlier number 2, there are several occasions where performance was around 60% of the best reported value. Although we can not confirm that the performance of the EPYC system varies precisely that much, we have definitely seen more variation in our EPYC benchmarks than on a comparable Intel system.
Originally published at https://www.anandtech.com/show/12084/epyc-benchmarks-by-intel-our-analysis- (Wayback Machine).