
Sizing Up Servers: Intel's Skylake-SP Xeon versus AMD's EPYC 7000 - The Server CPU Battle of the Decade?
Floating Point
Normally our HPC benchmarking is centered around OpenFoam, a CFD software we have used for a number of articles over the years. However, since we moved to Ubuntu 16.04, we could not get it to work anymore. So we decided to change our floating point intensive benchmark for now. For our latest article, we're testing with C-ray, POV-Ray, and NAMD.
The idea is to measure:
- A FP benchmark that is running out of the L1 (C-ray)
- A FP benchmark that is running out of the L2 (POV-Ray)
- And one that is using the memory subsytem quite often (NAMD)
Floating Point: C-ray
C-ray is an extremely simple ray-tracer which is not representative of any real world raytracing application. In fact, it is essentially a floating point benchmark that runs out of the L1-cache. Luckily it is not as synthetic and meaningless as Whetstone, as you can actually use the software to do simple raytracing.
We use the standard benchmarking resolution (3840x2160) and the "sphfract" file to measure performance. The binary was precompiled.
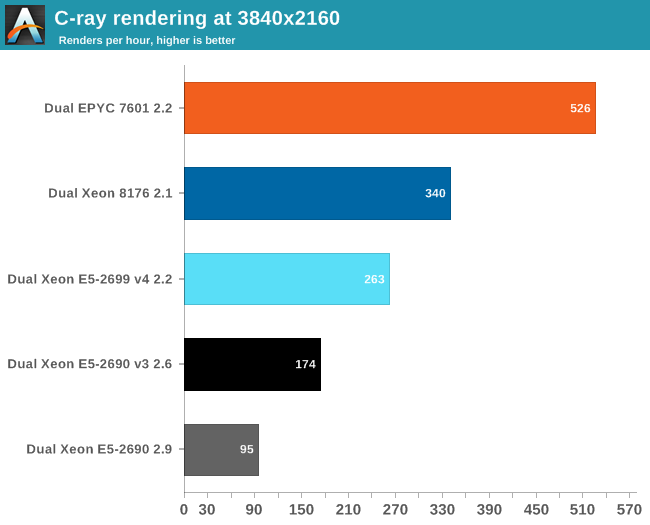
Wow. What just happened? It looks like a landslide victory for the raw power of the four FP pipes of Zen: the EPYC chip is no less than 50% faster than the competition. Of course, it is easy to feed FP units if everything resides in the L1. Next stop, POV-Ray.
Floating Point: POV-Ray 3.7
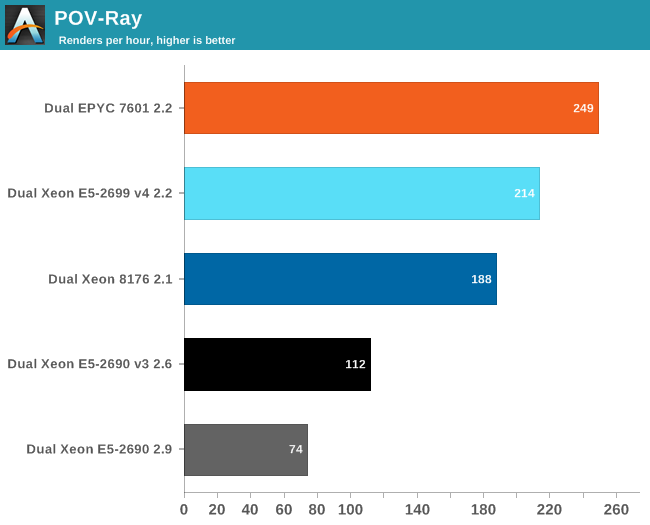
POV-Ray is known to run mostly out of the L2-cache, so the massive DRAM bandwidth of the EPYC CPU does not play a role here. Nevertheless, the EPYC CPU performance is pretty stunning: about 16% faster than Intel's Xeon 8176. But what if AVX and DRAM access come in to play? Let us check out NAMD.
Floating Point: NAMD
Developed by the Theoretical and Computational Biophysics Group at the University of Illinois Urbana-Champaign, NAMD is a set of parallel molecular dynamics codes for extreme parallelization on thousands of cores. NAMD is also part of SPEC CPU2006 FP. In contrast with previous FP benchmarks, the NAMD binary is compiled with Intel ICC and optimized for AVX.
First, we used the "NAMD_2.10_Linux-x86_64-multicore" binary. We used the most popular benchmark load, apoa1 (Apolipoprotein A1). The results are expressed in simulated nanoseconds per wall-clock day. We measure at 500 steps.
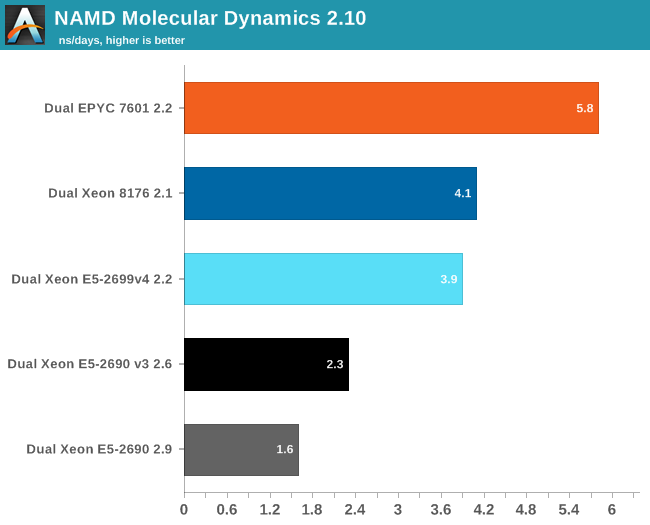
Again, the EPYC 7601 simply crushes the competition with 41% better performance than Intel's 28-core. Heavily vectorized code (like Linpack) might run much faster on Intel, but other FP code seems to run faster on AMD's newest FPU.
For our first shot with this benchmark, we used version 2.10 to be able to compare to our older data set. Version 2.12 seems to make better use of "Intel's compiler vectorization and auto-dispatch has improved performance for Intel processors supporting AVX instructions". So let's try again:
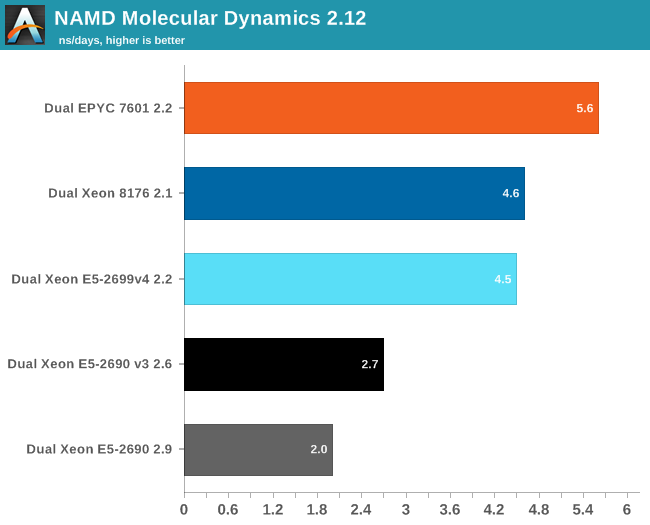
The older Xeons see a perforance boost of about 25%. The improvement on the new Xeons is a lot lower: about 13-15%. Remarkable is that the new binary is slower on the EPYC 7601: about 4%. That simply begs for more investigation: but the deadline was too close. Nevertheless, three different FP tests all point in the same direction: the Zen FP unit might not have the highest "peak FLOPs" in theory, there is lots of FP code out there that runs best on EPYC.
Originally published at https://www.anandtech.com/show/11544/intel-skylake-ep-vs-amd-epyc-7000-cpu-battle-of-the-decade (Wayback Machine).