
Test Driving Futuremark's PCMark 10 Benchmark
- Posted in
- Systems
- Futuremark
- Benchmarks
- PCMark 10
Benchmark Processing and Sensitivity Analysis
The PCMark 10 Extended benchmark was processed on a wide range of systems based on Skylake / Kaby Lake (since those were the ones that we had readily available). These ranged from a high-end gaming notebook to a passively-cooled mini-PC. The following list includes the main specifications of the systems.
- High-end Gaming Notebook: Razer Blade Pro 2016 (Razer BP16)
- Intel Core i7-6700HQ, NVIDIA GTX 1080 8GB, 32GB LPDDR4, 2x Samsung PM961 1TB
- High-end mini-PC: Intel Skull Canyon NUC (Intel NUC6i7KYK)
- Intel Core i7-6770HQ, Intel Iris Pro Graphics 580, 32GB LPDDR4, 1x Samsung 950 PRO 512GB
- Mid-range mini-PC: ECS LIVA Z Plus (ECS LIVA ZP)
- Intel Core i5-7300U, Intel HD Graphics 620, 4GB LPDDR4, 1x Transcend MTS400 128GB
- Passively-cooled mini-PC: Zotac ZBOX CI523 nano (Zotac CI523n)
- Intel Core i3-6100U, Intel HD Graphics 520, 16GB DDR3L, 1x Samsung SSD 840 EVO 128GB
- Mid-range Desktop PC: AnandTech's DAS Testbed (GIGABYTE Z170X-UD5 TH with Core i5-6600K) (SKL DAS TB)
- Intel Core i5-6600K, Intel HD Graphics 530, 32GB DDR4, 1x Samsung SSD SM951 256GB
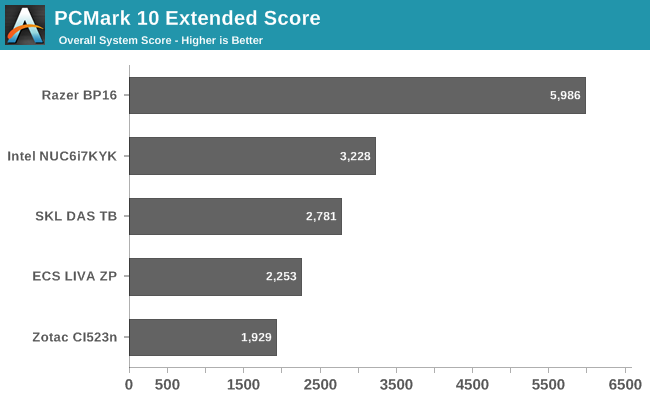
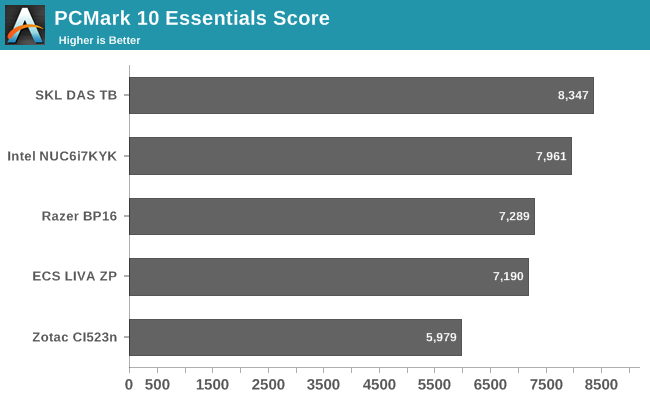
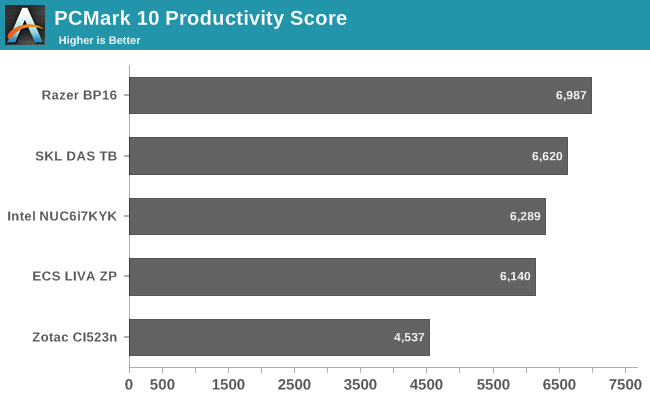
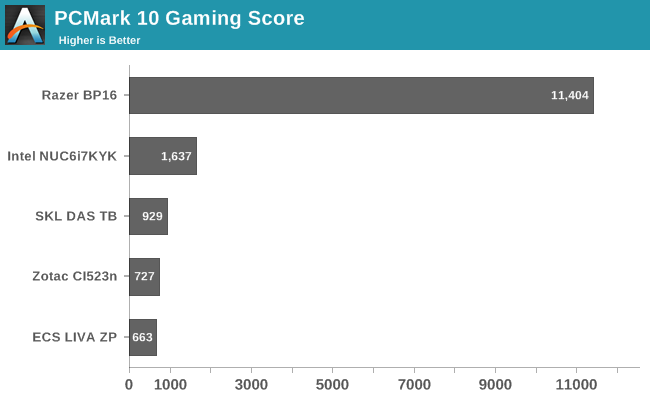
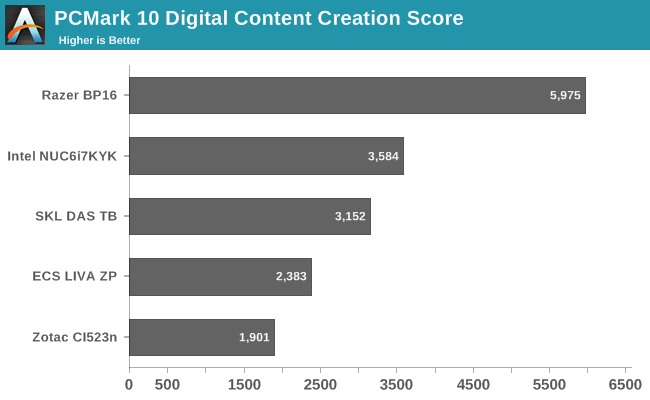
Sensitivity analysis was performed for three different aspects:
- Display resolution
- DRAM configuration
- Windows 10 Power Profile setting
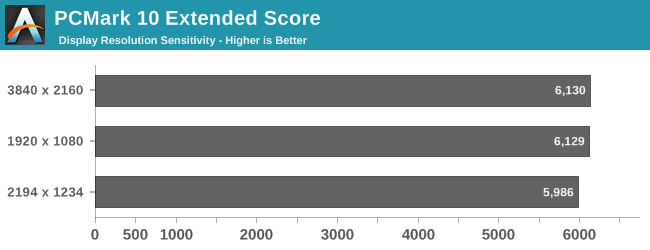
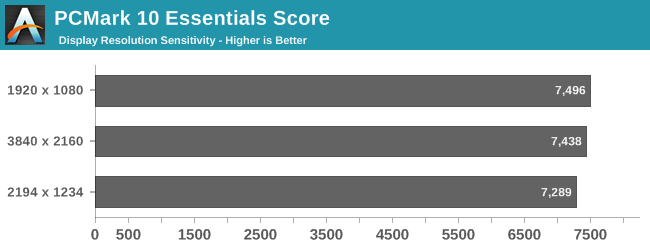
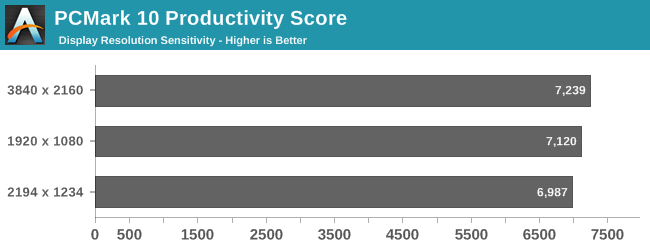
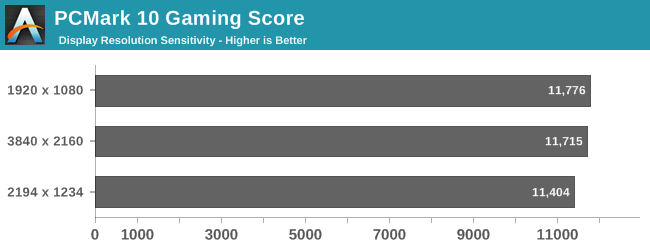
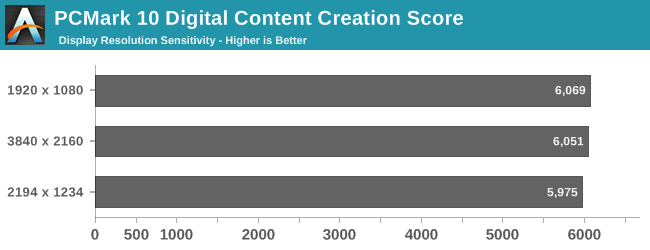
In order to test out the sensitivity of the scores to the display resolution, we chose the Razer Blade Pro 2016 as the test system. One of the interesting aspects with DPI scaling is that PCMark 10 reports the effective resolution. For example, with the Razer Blade Pro set to 175% scaling, the 4K screen was recorded as 2194 x 1234 px. We ran the PCMark 10 Extended benchmark at that resolution, and also with the DPI scaling set to 100% (for a 3840 x 2160 resolution). In addition, we also drove a 1080p monitor over the HDMI port and set it as the sole display before processing the benchmark. The results below show that resolutions of 1080p and above all result in no significant differences in the PCMark 10 scores. That said, having DPI scaling activated seems to affect the scores negatively by a small amount.
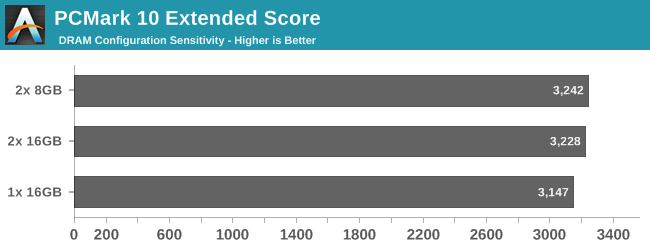
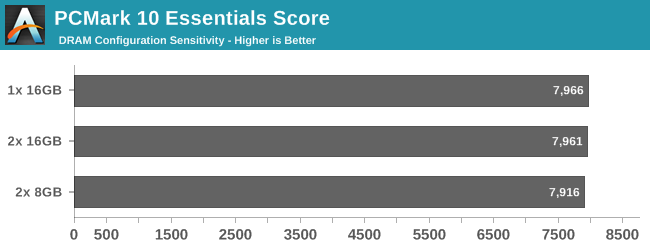
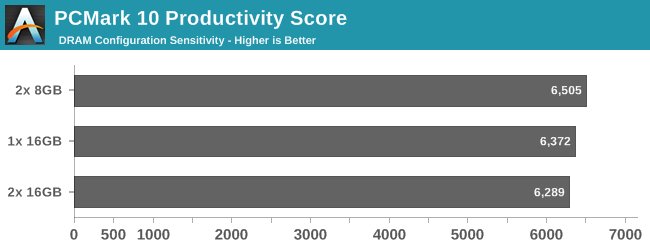
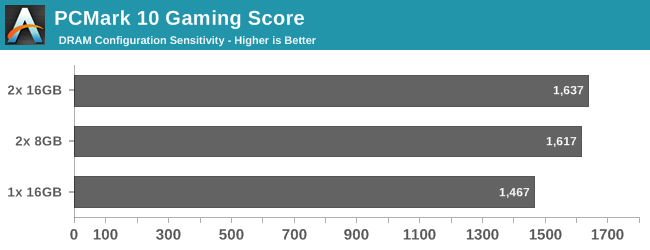
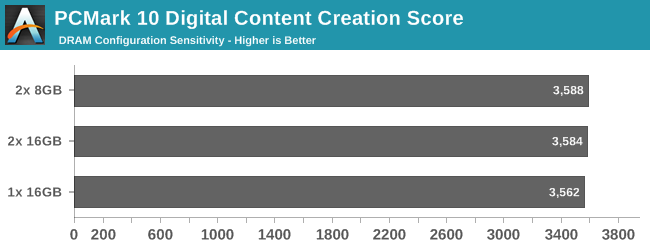
In order to test out the sensitivity of the scores to the DRAM configuration, we chose the Intel Skull Canyon NUC (NUC6i7KYK) as the test system. Our default configuration was with 2x 16GB DDR4 SODIMMs. We repeated the tests with only one slot occupied (1x 16GB) and with both slots occupied by 8GB SODIMMs 2x 8GB). The results below show that the performance (particularly for workloads utilizing the GPU) suffers a bit when one slot is unoccupied, but, there is no significant difference in the scores when moving from 16GB to 32GB of memory.
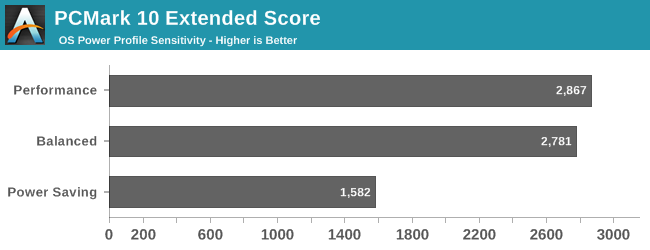
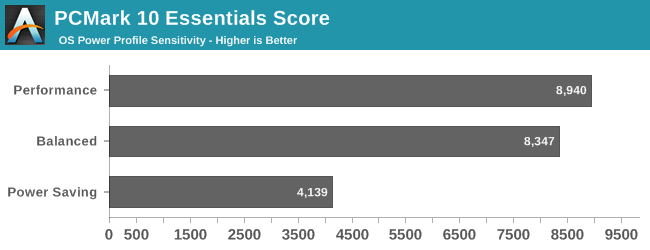
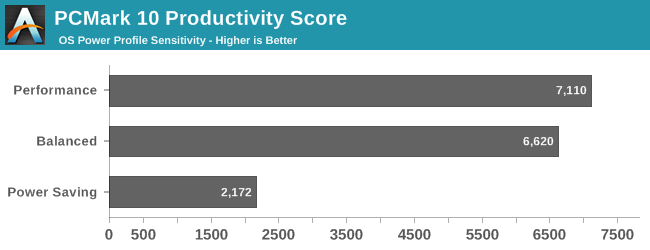
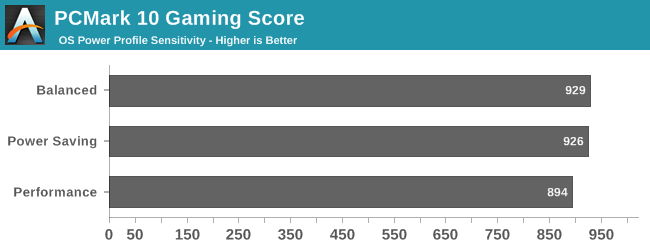
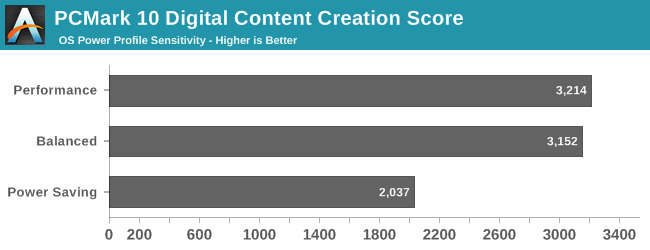
Our final sensitivity analysis test looks at how the scores vary with changes in the Windows power plan. For this purpose, we chose our desktop PC (AnandTech DAS Testbed) with the Core i5-6600K in the GIGABYTE Z170X-UD5 TH motherboard. Depending on the system, Winows provides a collection of hardware and software settings under various power profiles. Systems usually default to the balanced profile. We ran the PCMark 10 Extended benchmark with the power profile set to 'High performance' and 'Power saver' also. As the results below show, it is very important to ensure that the power profile is consistent across different systems whose scores are going to be compared.
Originally published at https://www.anandtech.com/show/11499/futuremark-pcmark-10 (Wayback Machine).