
The Intel Optane Memory (SSD) Preview: 32GB of Kaby Lake Caching
Sequential Read
Sequential access is usually tested with 128kB transfers, which is large enough that requests can typically be striped across multiple controller channels and still involve writing a full page or more to the flash on each channel. Real-world sequential transfer sizes vary widely depending on factors like which application is moving the data or how fragmented the filesystem is.
The drives were preconditioned with two full writes using 4kB random writes, so the data on each drive is entirely fragmented. This may limit how much prefetching of user data the drives can perform on the sequential read tests, but they can likely benefit from better locality of access to their internal mapping tables. These tests were conducted on the Optane Memory as a standalone SSD, not in any caching configuration.
Queue Depth 1
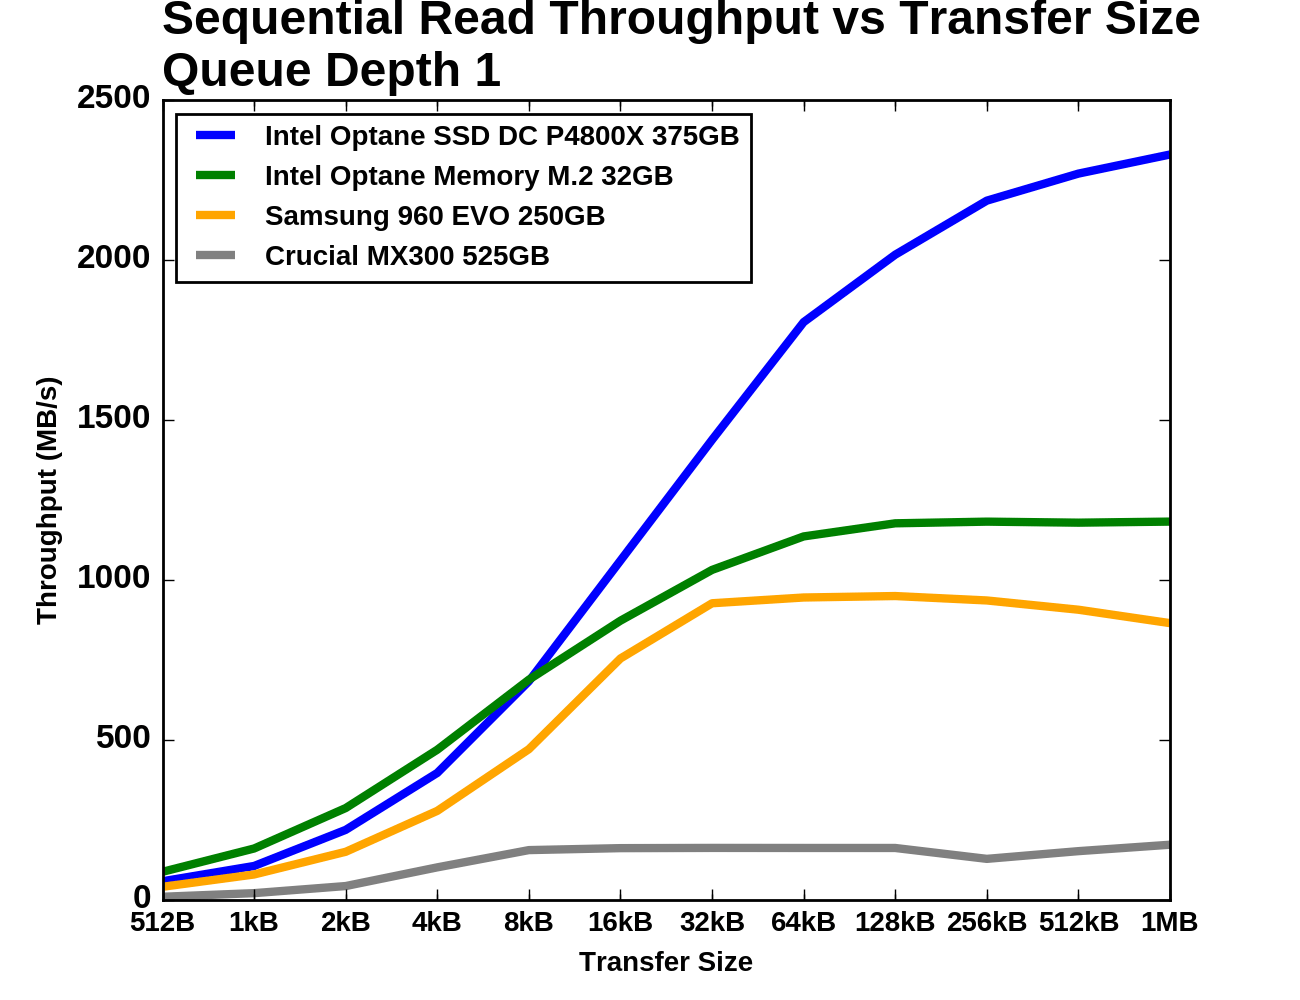
The test of sequential read performance at different transfer sizes was conducted at queue depth 1. Each transfer size was used for four minutes, and the throughput was averaged over the final three minutes of each test segment.
 |
|||||||||
| Vertical Axis scale: | Linear | Logarithmic | |||||||
The three PCIe drives show similar growth through the small to mid transfer sizes, but the Optane Memory once again has the highest performance for small transfers and higher performance across the board than the Samsung 960 EVO.
Queue Depth > 1
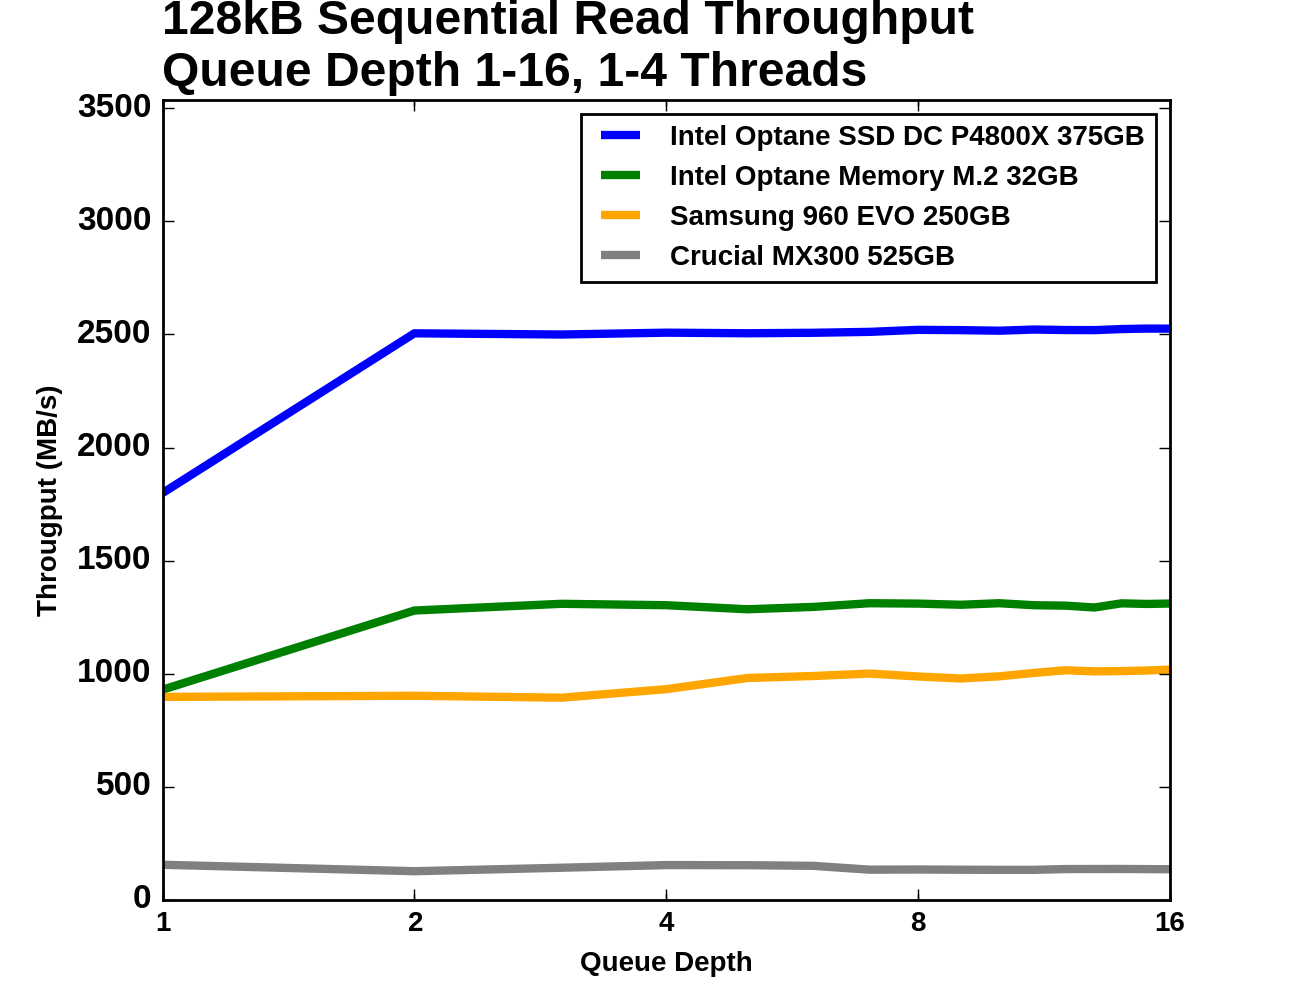
For testing sequential read speeds at different queue depths, we use the same overall test structure as for random reads: total queue depths of up to 64 are tested using a maximum of four threads. Each thread is reading sequentially but from a different region of the drive, so the read commands the drive receives are not entirely sorted by logical block address.

The Samsung 960 EVO and Optane Memory start out with QD1 sequential read performance and latency that is relatively close, but then at higher queue depths the Optane Memory jumps up to a significantly higher throughput.
 |
|||||||||
| Vertical Axis scale: | Linear | Logarithmic | |||||||
The two Optane devices saturate for sequential reads at QD2, but the Optane Memory experiences a much smaller jump from its QD1 throughput. The flash SSDs are mostly saturated from the start. The Crucial MX300 delivers far lower performance than SATA allows for, due to this test being multithreaded with up to four workers reading from different parts of the drive.
 |
|||||||||
| Mean | Median | 99th Percentile | 99.999th Percentile | ||||||
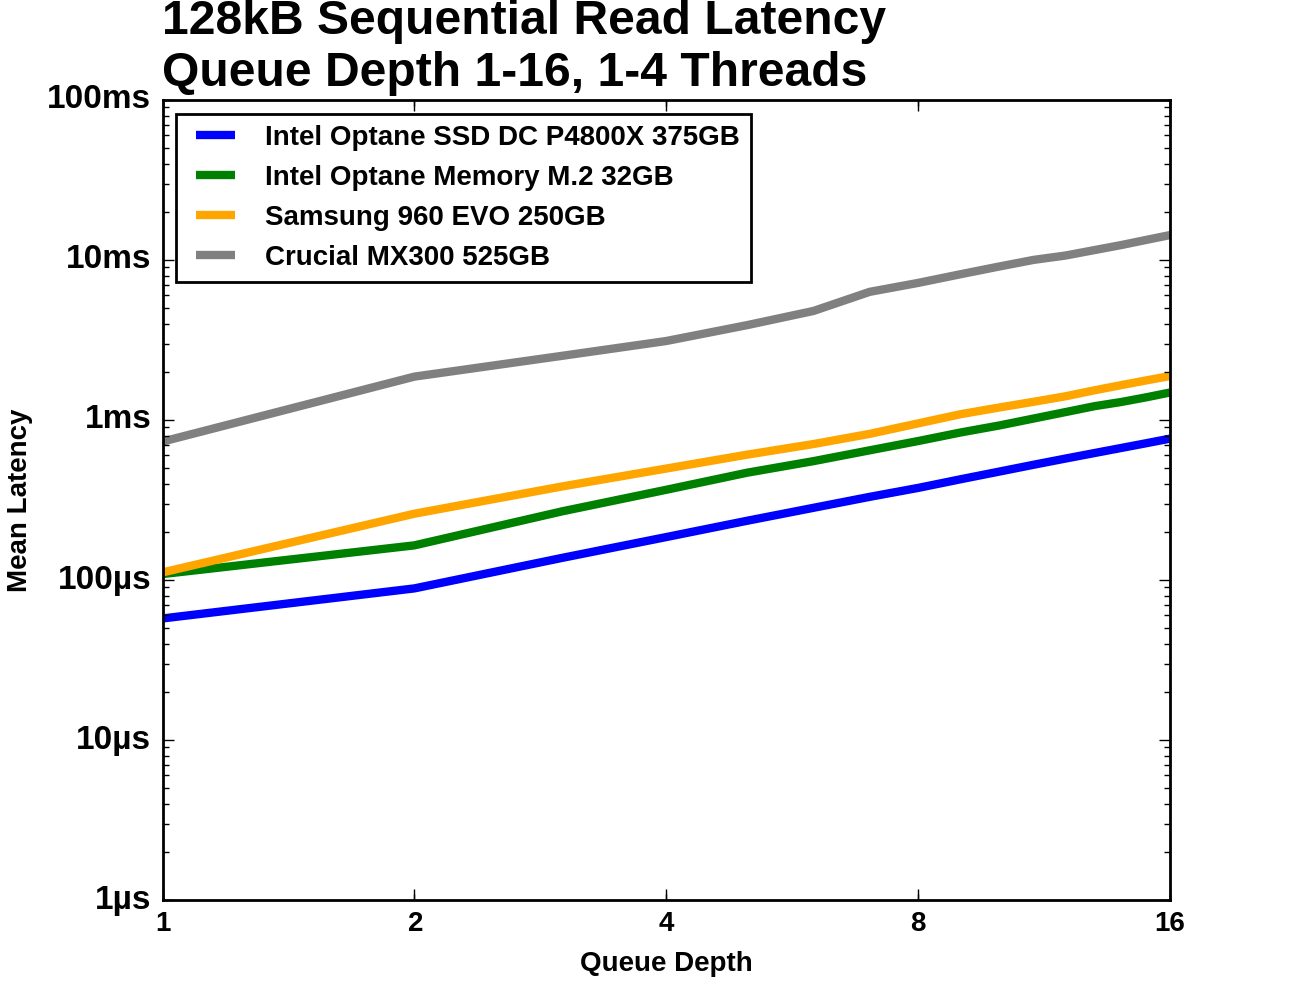
Since all four drives are saturated through almost all of this test, the latency graphs are fairly boring: increasing queue depth increases latency. For mean and median latency the Optane Memory and the Samsung 960 EVO are relatively close, but for the 99th and 99.999th percentile metrics the 960 EVO is mostly slower than the Optane Memory by about the same factor of two that the P4800X beats the Optane Memory by.
Sequential Write
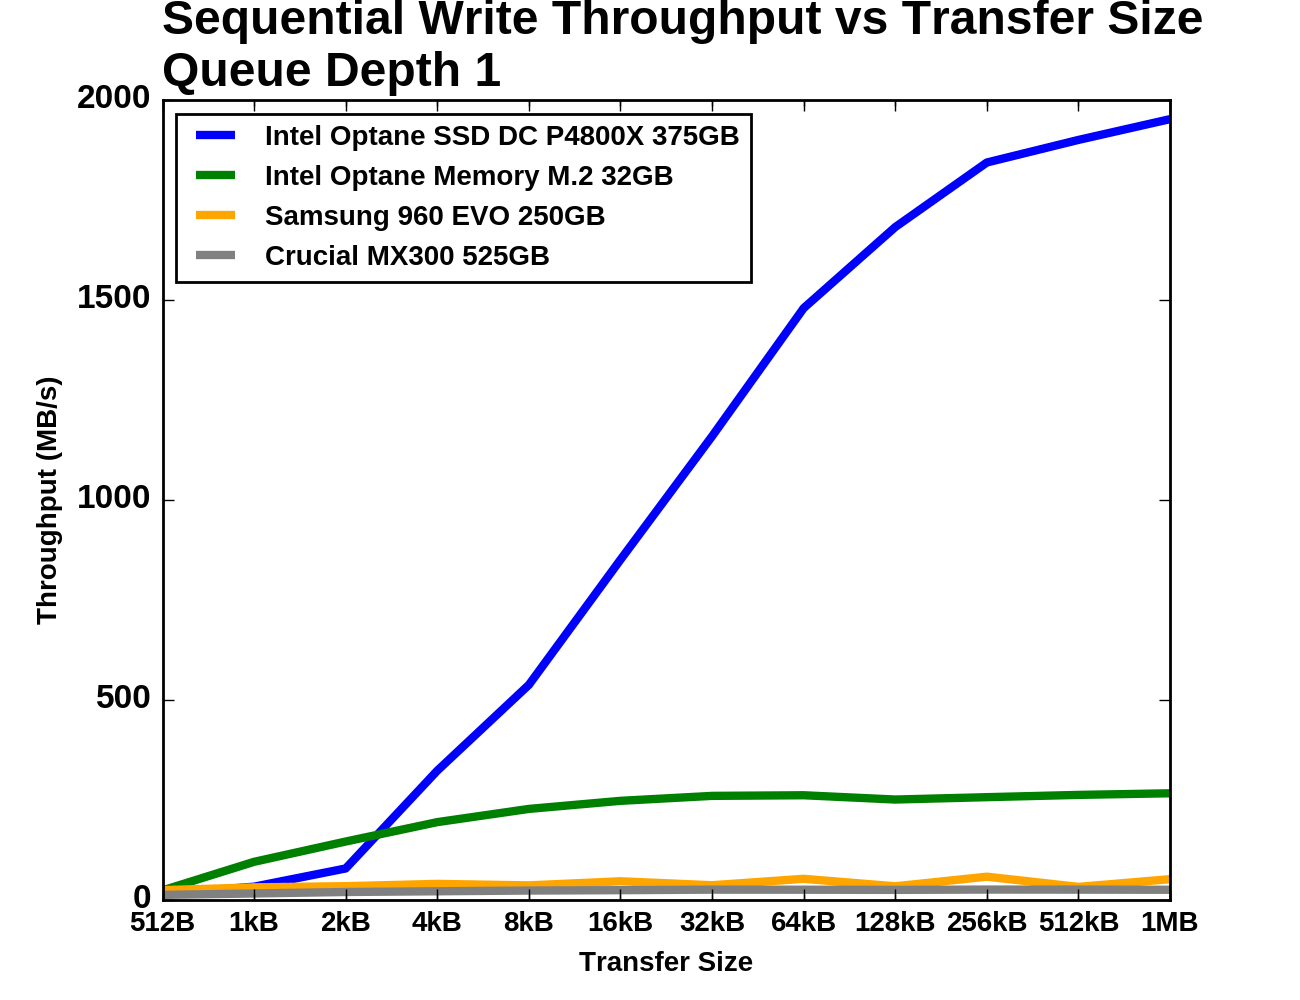
The sequential write tests are structured identically to the sequential read tests save for the direction the data is flowing. The sequential write performance of different transfer sizes is conducted with a single thread operating at queue depth 1. For testing a range of queue depths, a 128kB transfer size is used and up to four worker threads are used, each writing sequentially but to different portions of the drive. Each sub-test (transfer size or queue depth) is run for four minutes and the performance statistics ignore the first minute. These tests were conducted on the Optane Memory as a standalone SSD, not in any caching configuration.
 |
|||||||||
| Vertical Axis scale: | Linear | Logarithmic | |||||||
The enterprise-focused Optane SSD P4800X is slower than the consumer Optane Memory for sequential writes of less than 4kB, and even the Samsung 960 EVO beats the P4800X at 512B transfers. The 960 EVO's performance is inconsistent through the second half of the test but on average it is far closer to the MX300 than either Optane device. For larger transfers the MX300 is about a tenth the speed of the Optane Memory.
Queue Depth > 1

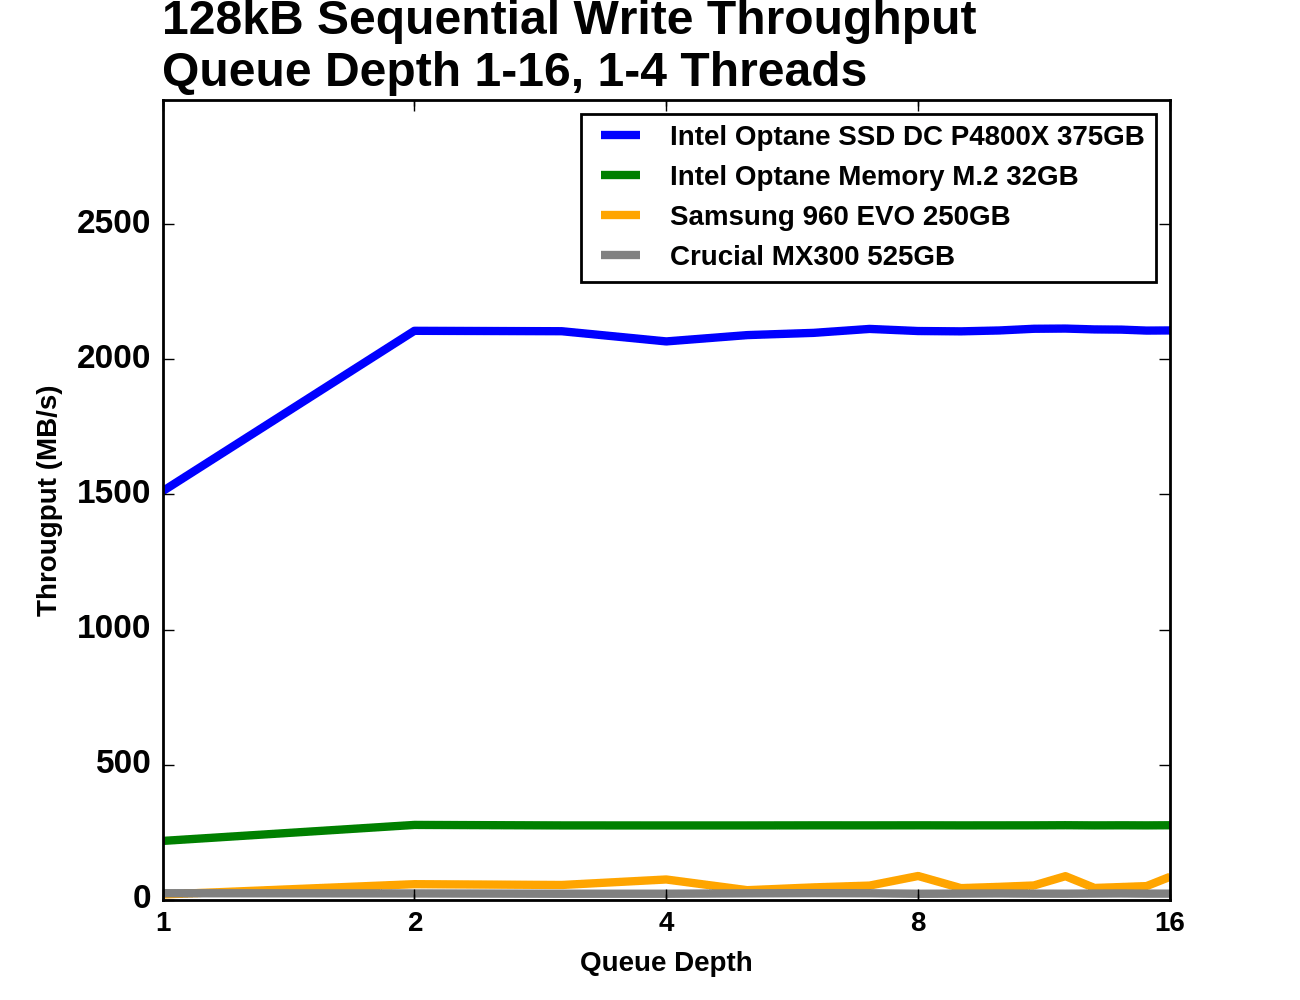
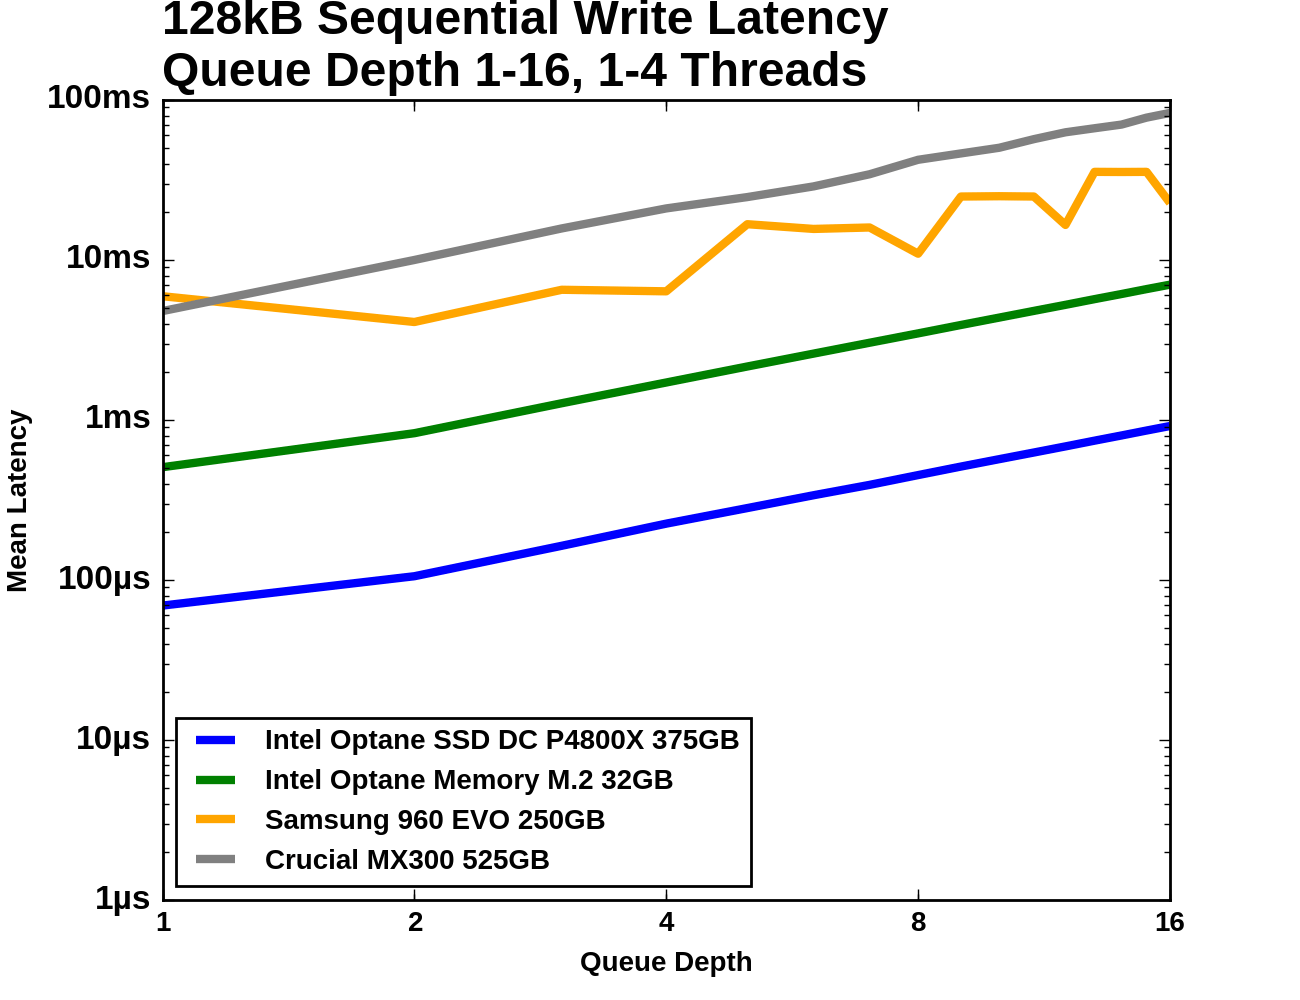
The sequential write throughput of the Optane SSD DC P4800X dwarfs that of the other three drives, even the Optane Memory. The Optane Memory does provide substantially higher throughput than the flash SSDs, but it does not have a latency advantage for sequential writes.
 |
|||||||||
| Vertical Axis scale: | Linear | Logarithmic | |||||||
The Crucial MX300 is the only drive that does not get a throughput boost going from QD1 to QD2; as with the random write test it is not able to improve performance when the higher queue depth is due to multiple threads writing to the drive. The Samsung 960 EVO improves from the addition of a second thread but beyond that it simply gets more inconsistent. The Optane Memory and P4800X are both very consistent and saturated at QD2 after a moderate improvement from QD1.
 |
|||||||||
| Mean | Median | 99th Percentile | 99.999th Percentile | ||||||
The flash SSDs get more inconsistent with increased thread count and queue depth, but other than that the latency charts show the predictable growth in latency that comes from the drives all being saturated in terms of throughput.
Originally published at https://www.anandtech.com/show/11210/the-intel-optane-memory-ssd-review-32gb-of-kaby-lake-caching (Wayback Machine).